Dashboards
A dashboard arranges live widgets (charts, gauges, cards, alarm tables, command buttons, maps) on one page. Dashboards belong to the tenant, and each one is versioned: you edit a draft, then publish it as the version everyone else sees.
This chapter is for people who build and maintain dashboards. It covers the dashboard list, creating a dashboard from scratch, from a template or from an exported file, viewing it, editing it on the canvas, configuring widgets, previewing with synthetic data, exporting, and publishing and rolling back versions. The screenshots use a test tenant whose Widget Lab dashboard holds one of every built-in widget. For how dashboards work underneath, see Dashboards.
Every member of the tenant can open a dashboard. Creating, editing, publishing and deleting one needs the dashboard write permission. A member without it is shown the published version, never the draft. If a dashboard has never been published, they are told to ask an author to publish it.
The dashboard list
Choose Dashboards in the sidebar.
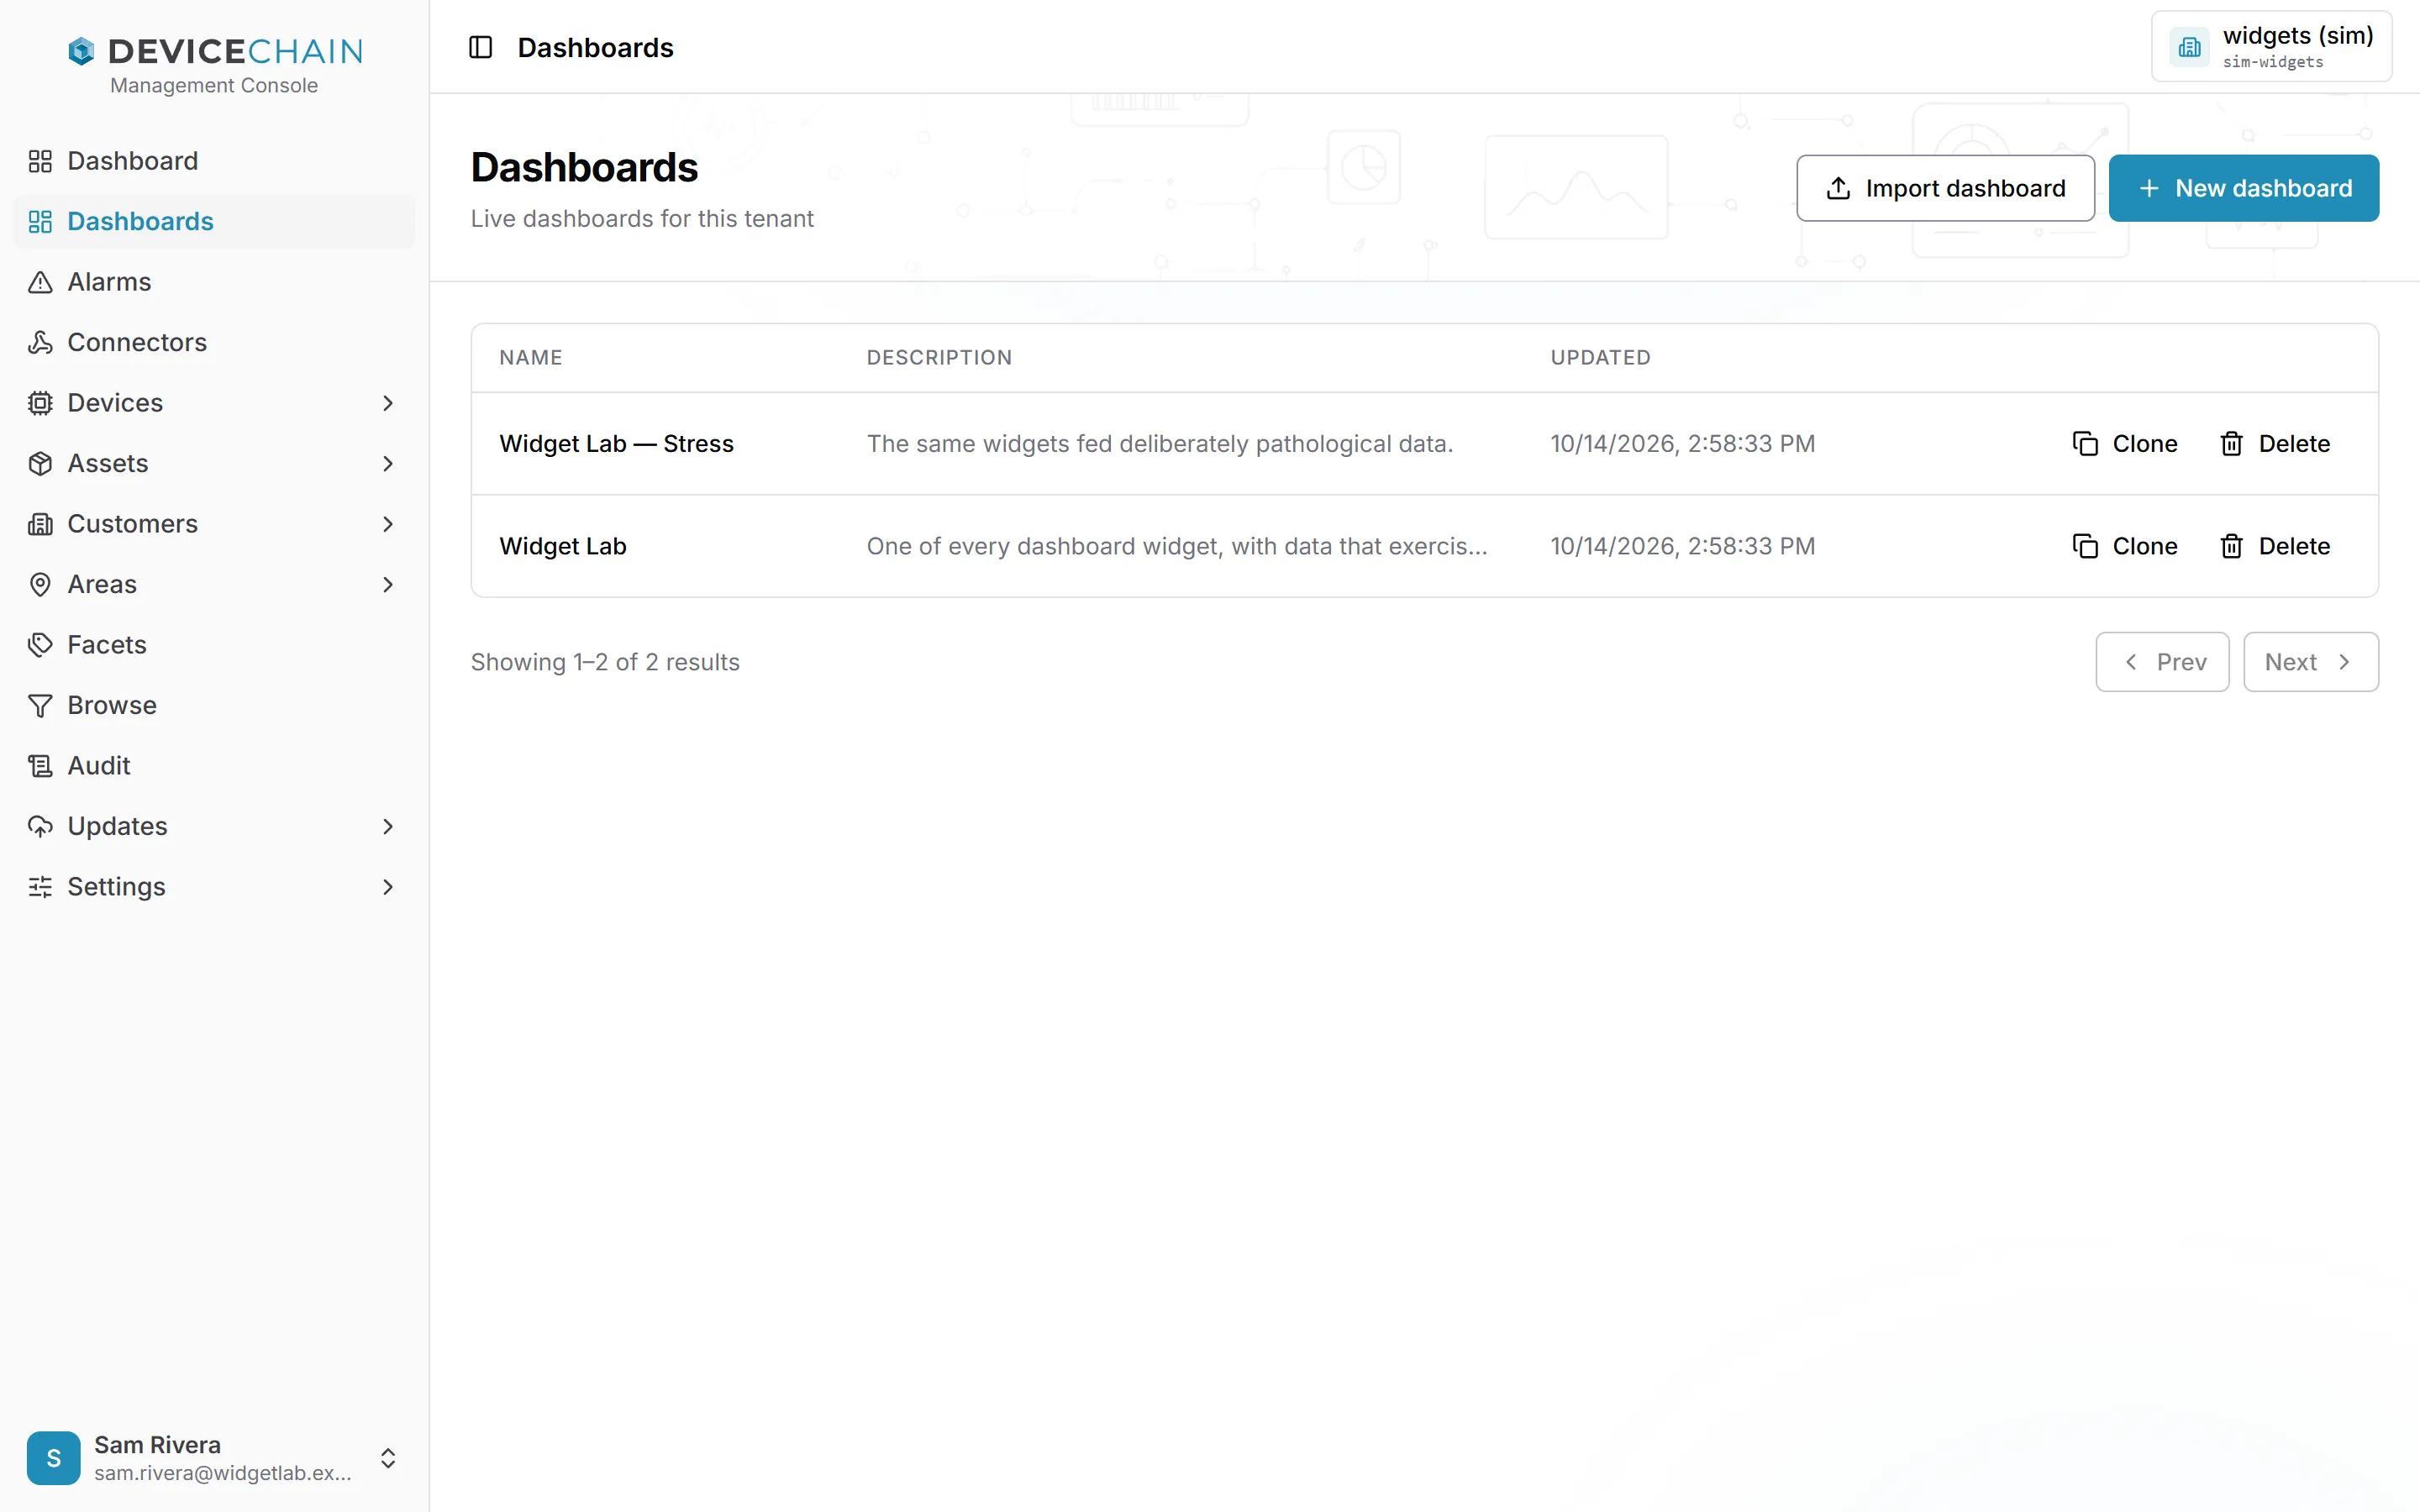
Each row shows the dashboard's name, description and when it was last updated. Select a row to open it. Clone makes a copy under a new token, and Delete removes the dashboard after you confirm. Deleting cannot be undone.
Creating a dashboard
New dashboard opens a drawer with two ways to start.
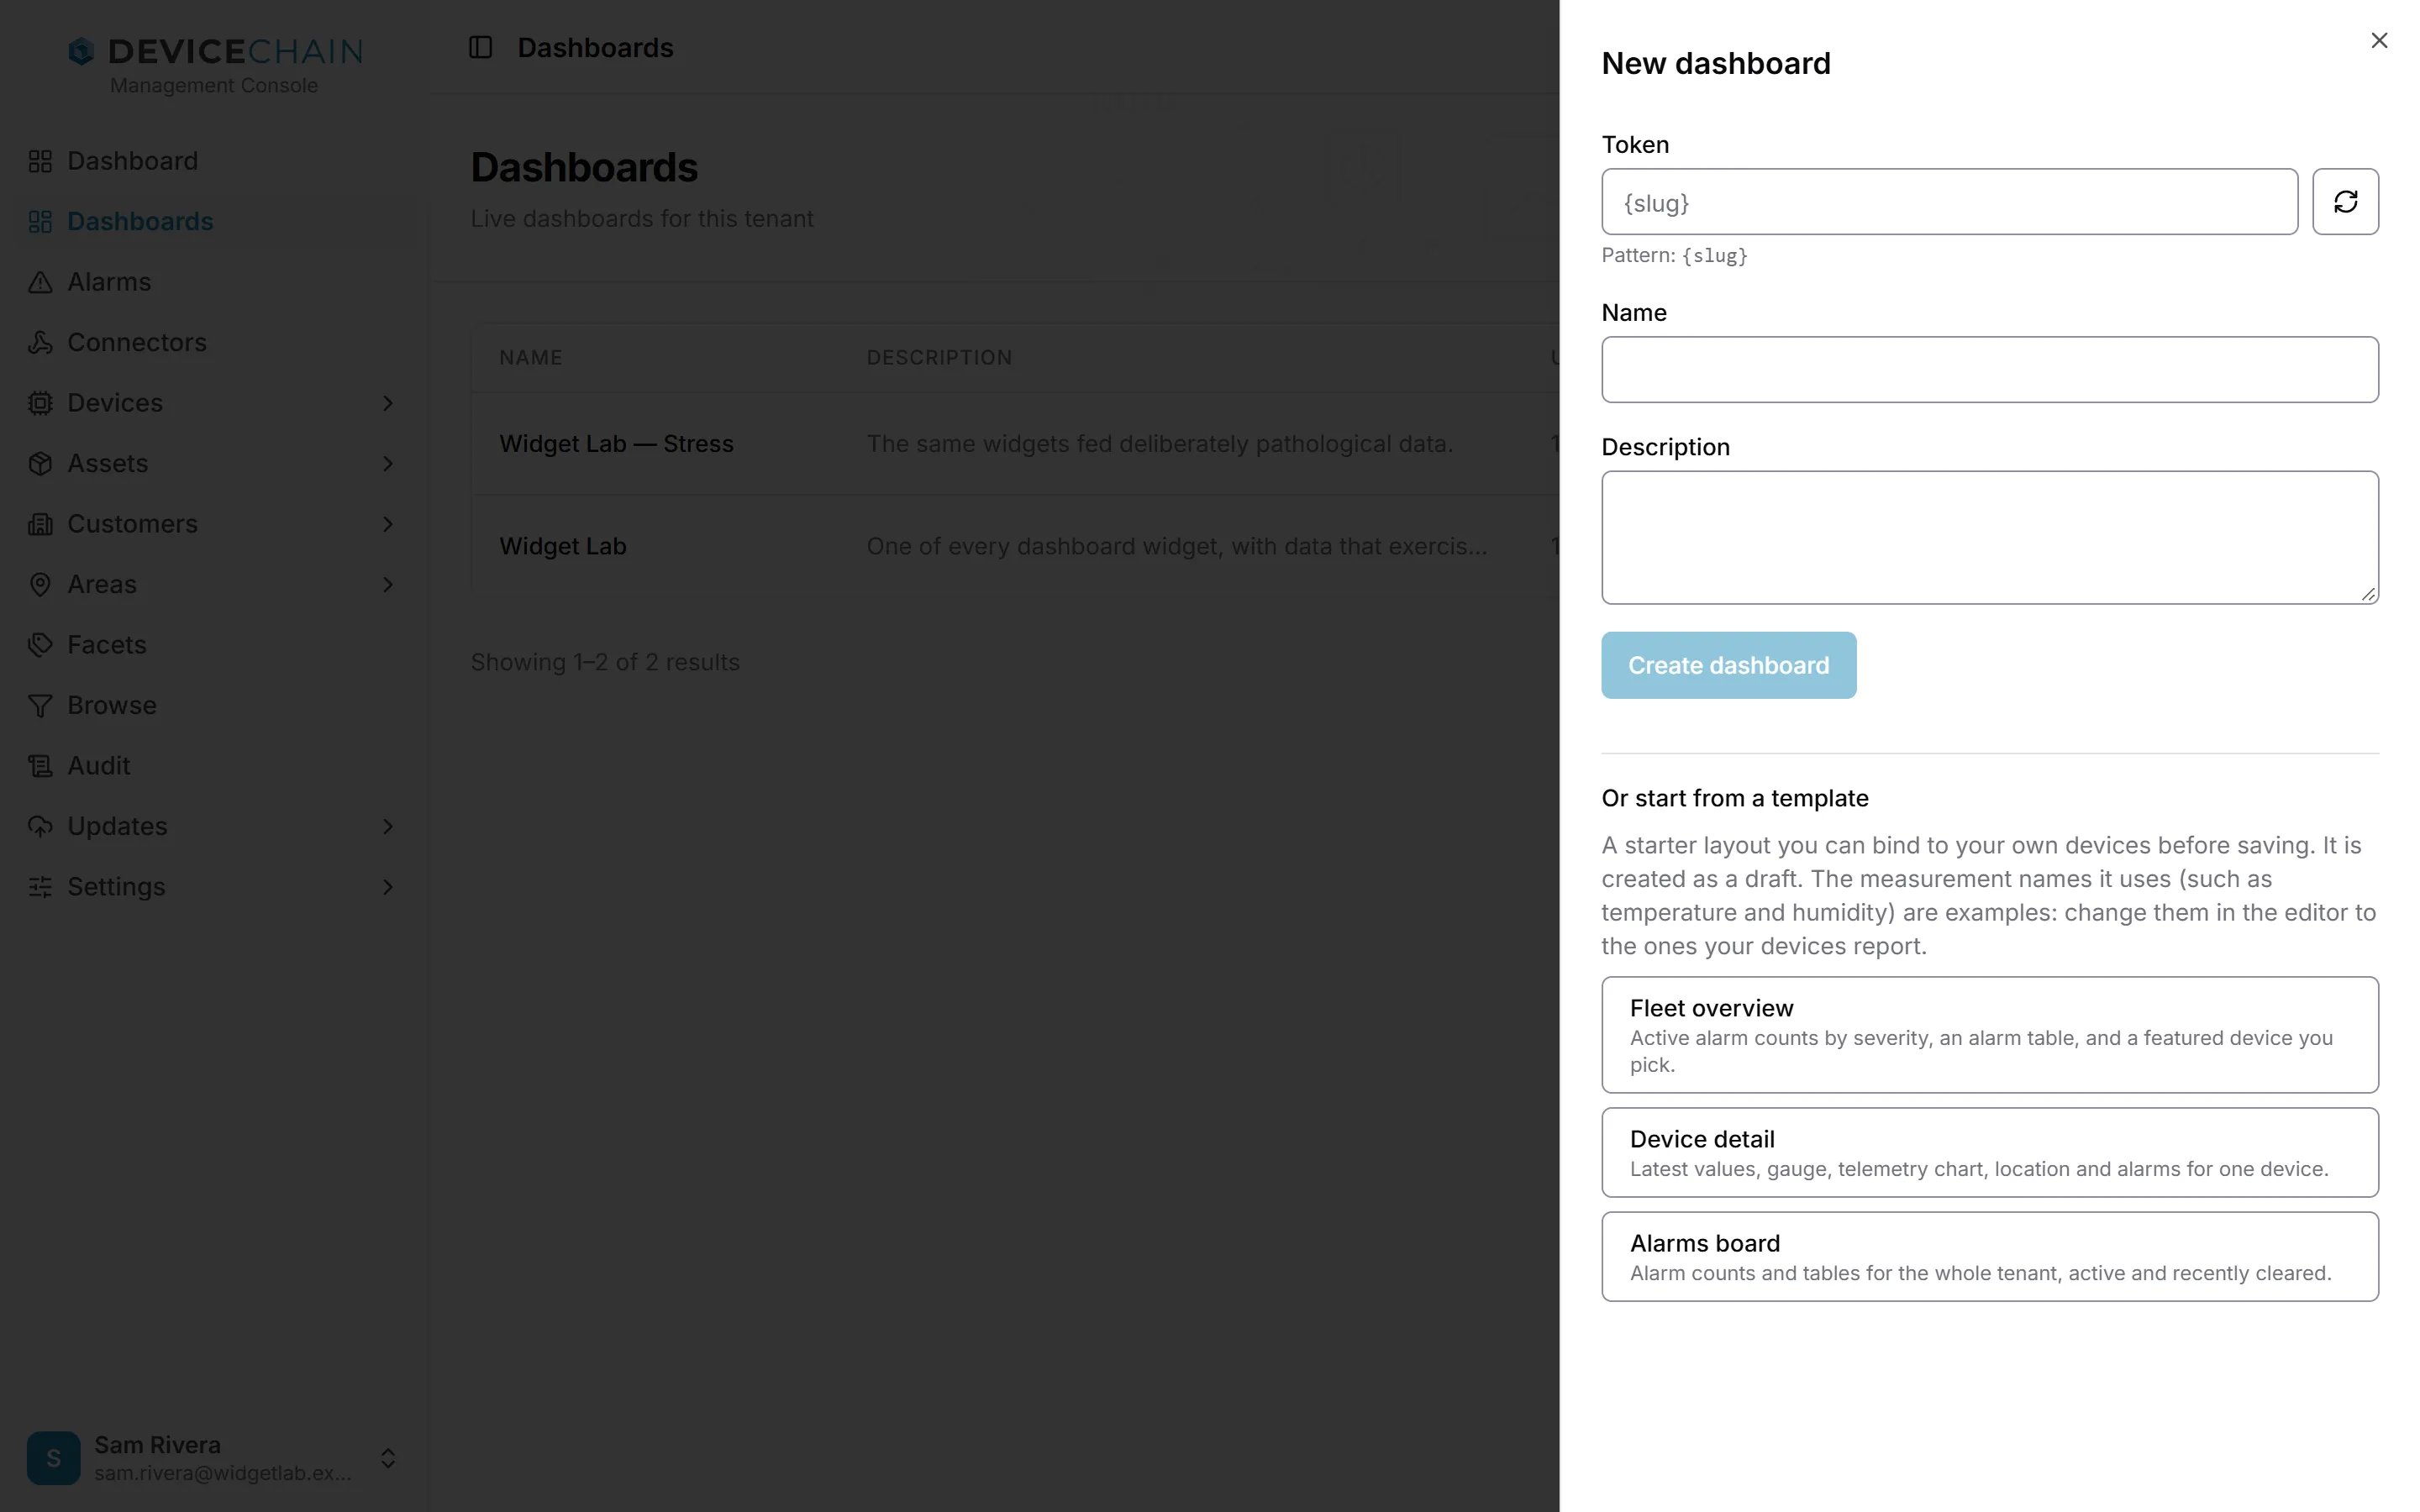
- From scratch. Type a token, the dashboard's permanent id, or use the button beside the field to generate one. The token is the only required field; a name and a description are optional. The field marks a token that is already taken. Choose Create dashboard and the empty dashboard opens.
- From a template. Under Or start from a template, pick Fleet overview (alarm counts by severity, an alarm table and a featured device), Device detail (latest values, a gauge, a telemetry chart, location and alarms for one device) or Alarms board (alarm counts and tables for the whole tenant). The template opens in the import review described below, where you bind it to your own devices before it is created.
Template measurement names such as temperature and humidity are examples. Change them in the
editor to the ones your devices report.
Importing a dashboard
Import dashboard creates a new dashboard from JSON exported from another dashboard or another tenant.
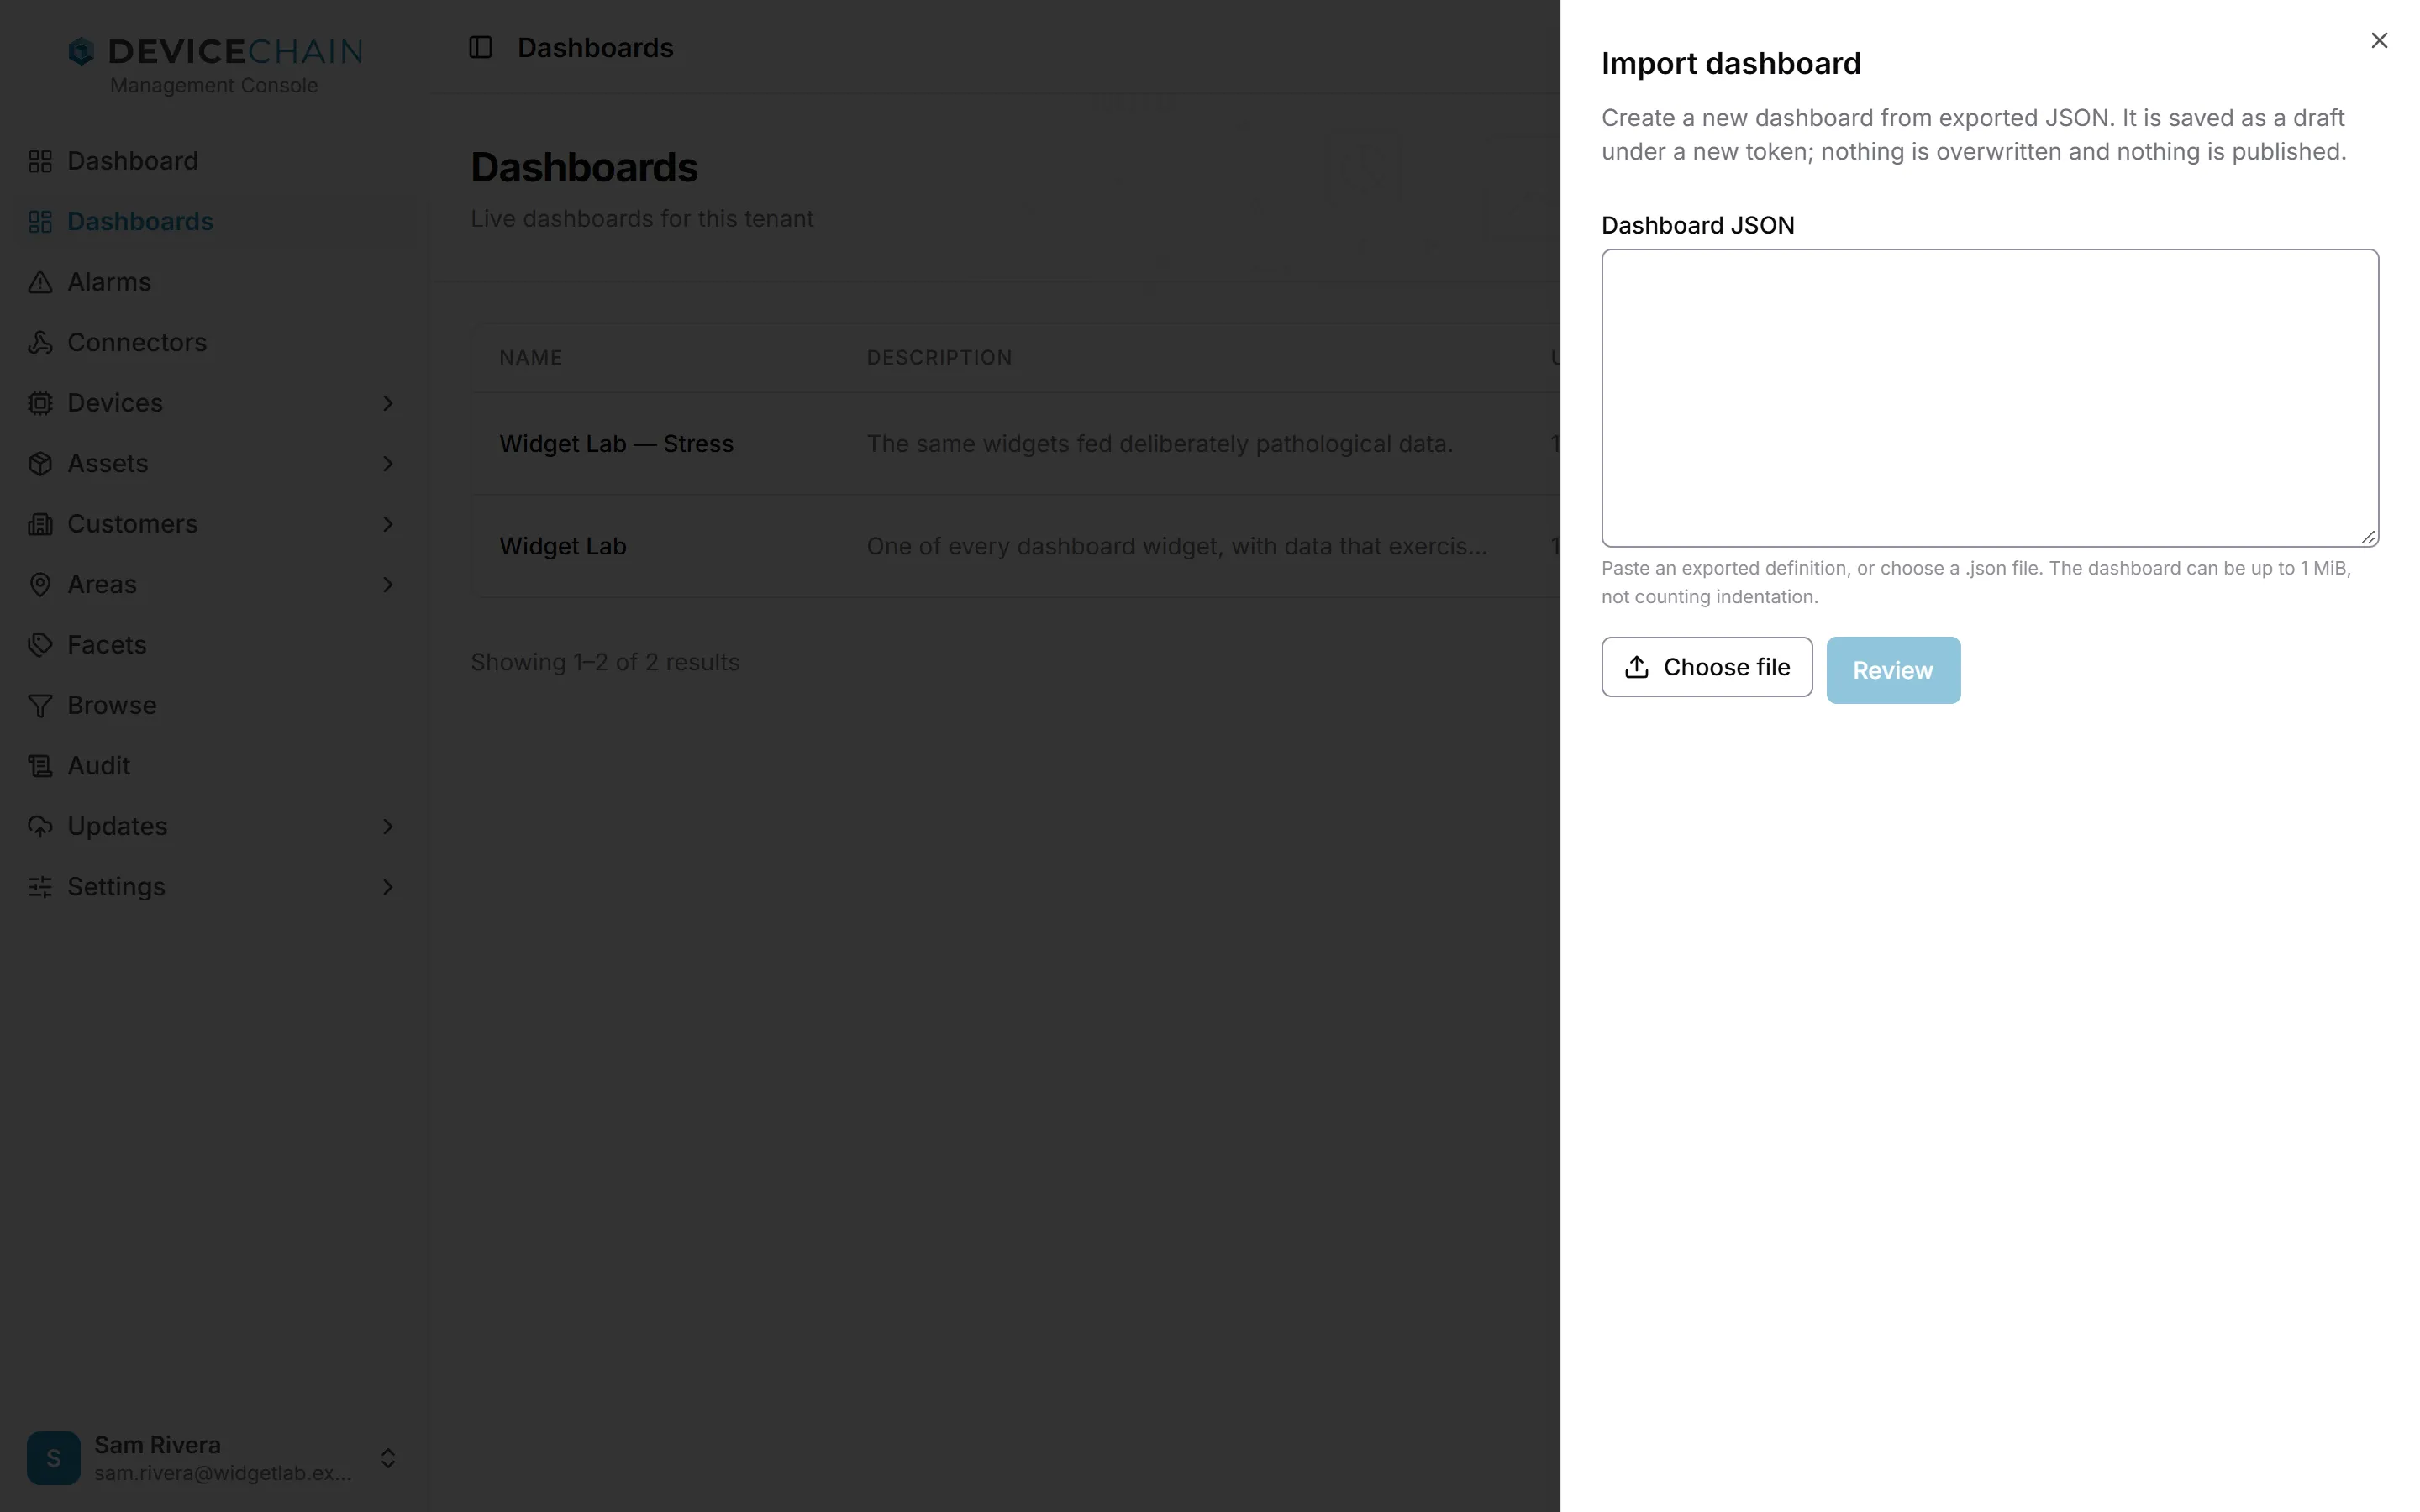
- Paste the JSON into Dashboard JSON, or use Choose file to load a
.jsonfile. - Choose Review. The console checks the definition and lists anything you should look at
before it is saved:
- Bindings to review: slots that are not bound yet, or that name a device, customer, area or asset that does not exist in this tenant. Pick one from this tenant for each, or leave the picker at Leave unbound and bind it later.
- widgets this console cannot show, which are kept as placeholders and block publishing until they are installed or removed;
- widget options to fix;
- external sites the dashboard loads images or map tiles from.
- Give the new dashboard a token and choose Create draft.
An import never overwrites an existing dashboard, and it is never published for you. Clone and the templates use the same review.
Viewing a dashboard
Opening a dashboard shows it with live data.
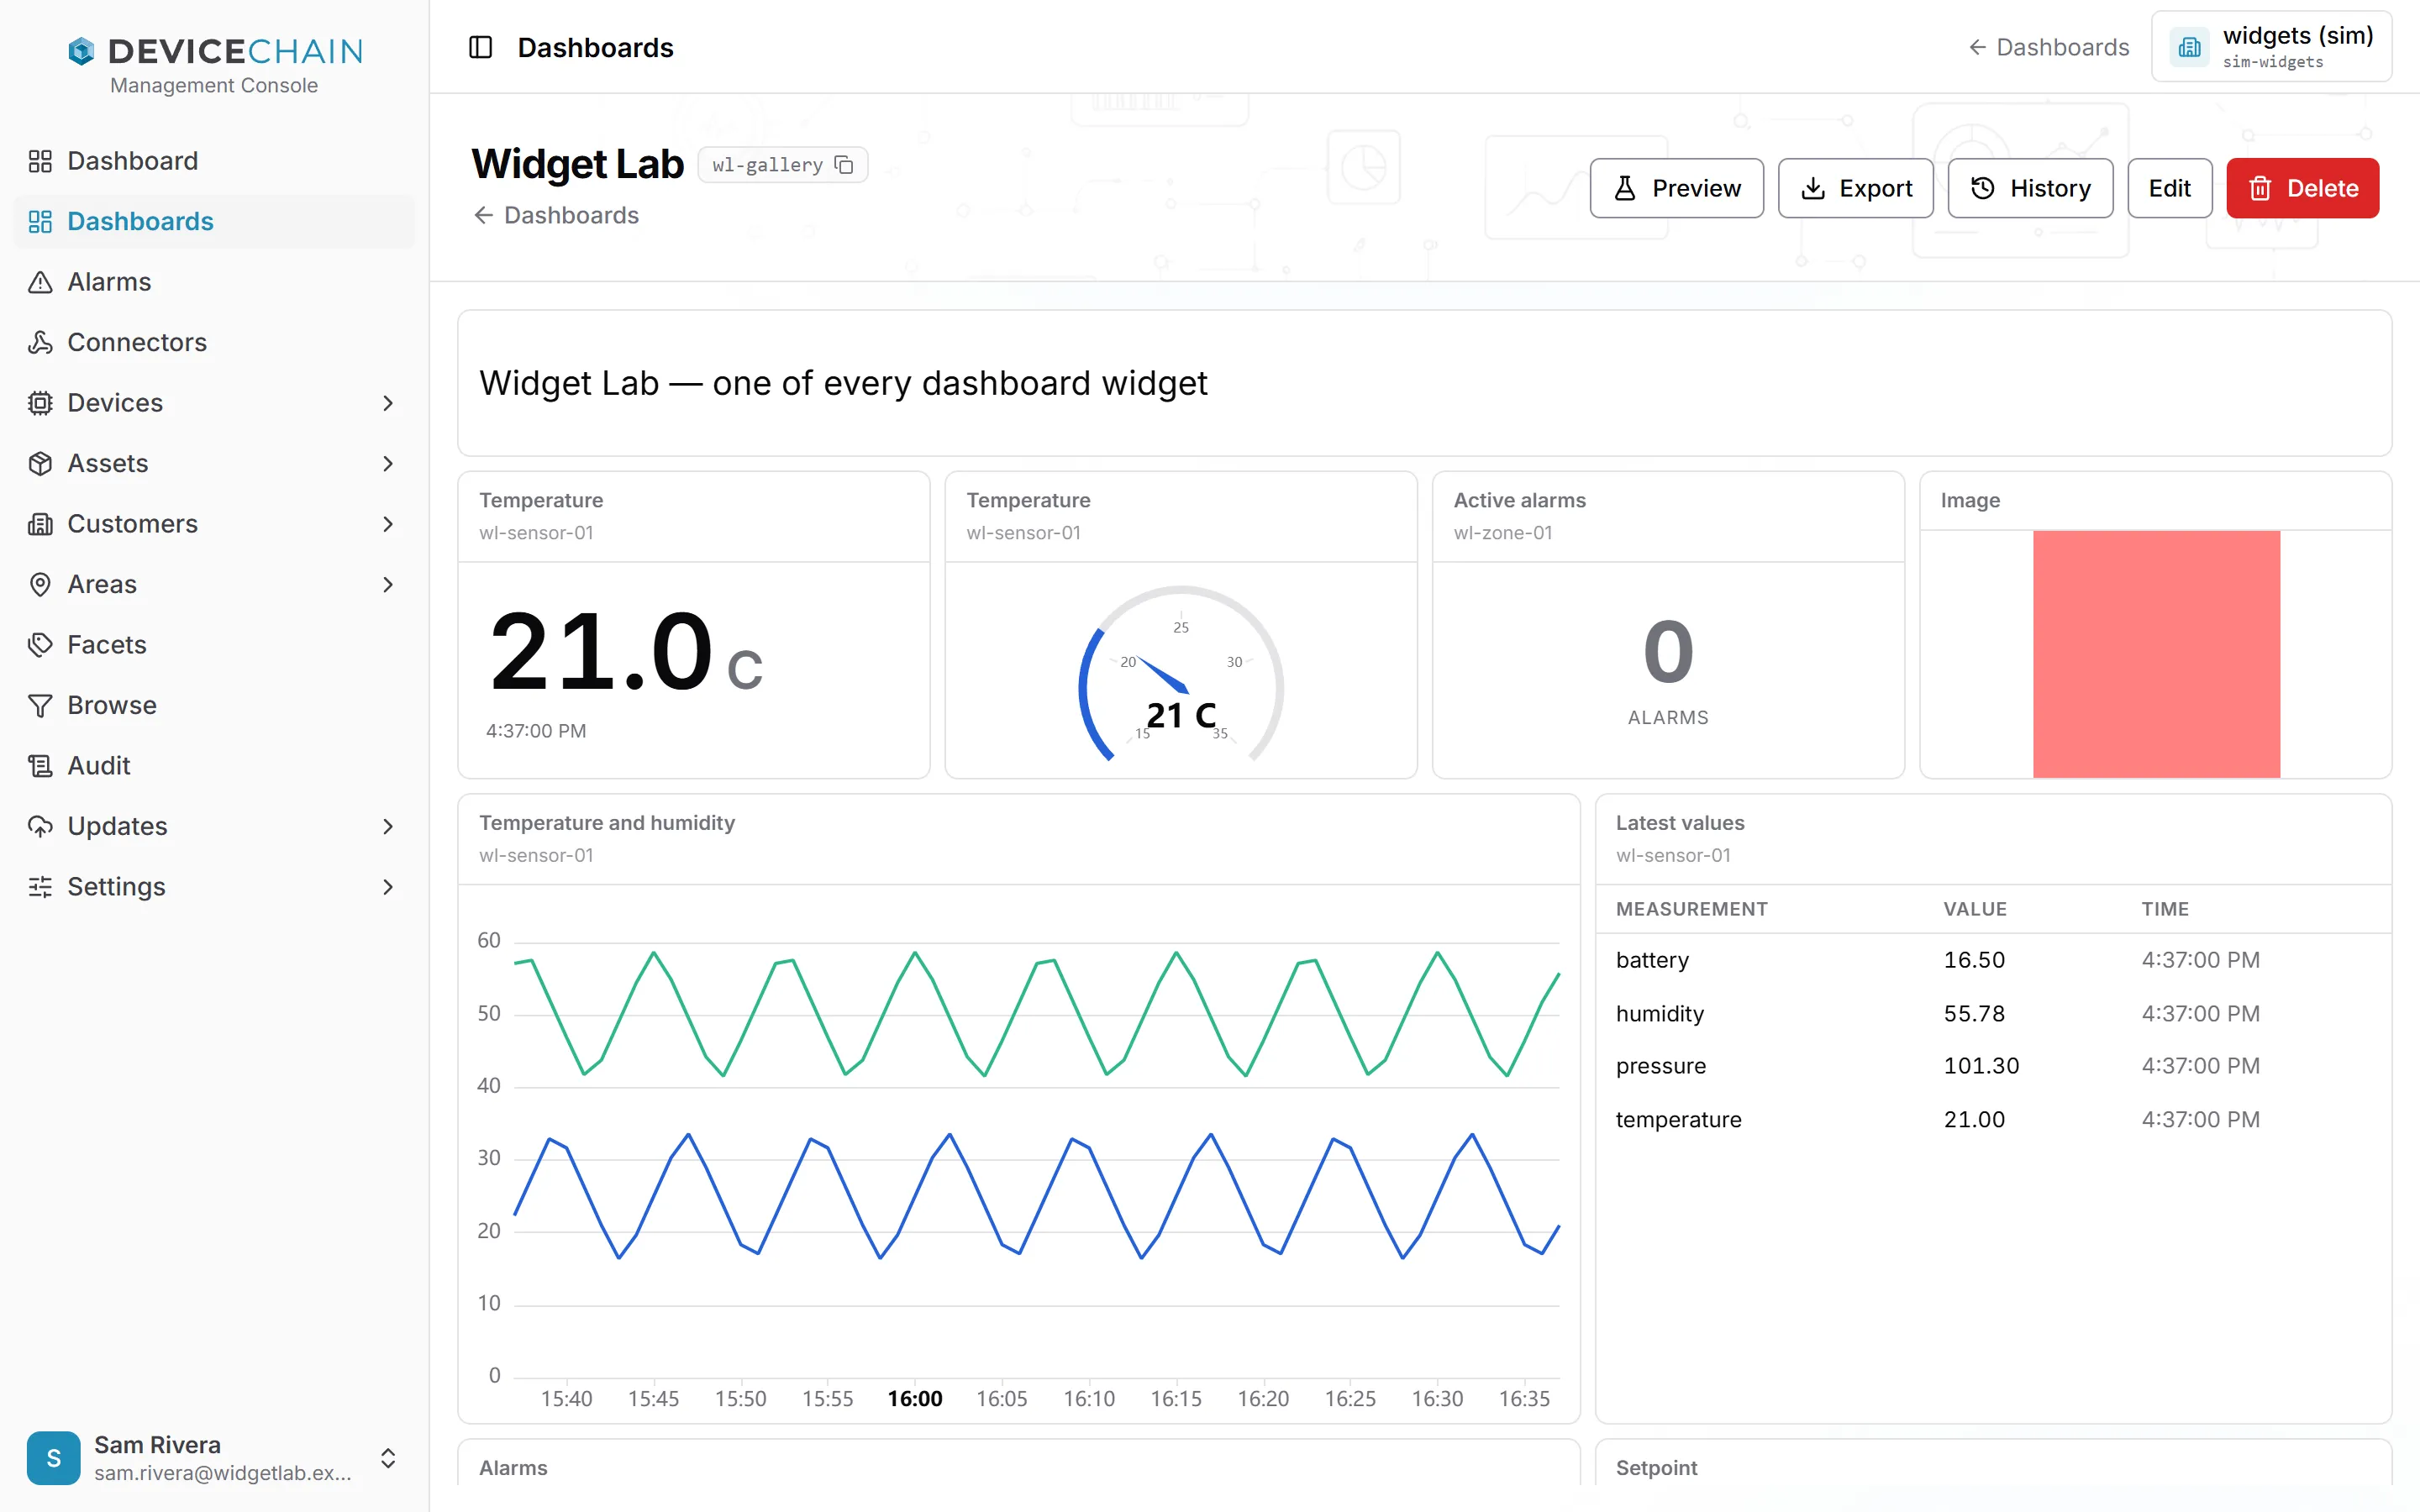
The buttons along the top:
- Preview swaps live data for generated data (see Previewing with synthetic data).
- Export copies or downloads the dashboard (see Exporting).
- History opens the version history (see Versions).
- Edit switches to the editor.
- Delete removes the dashboard.
Widgets that carry actions, such as acknowledging an alarm or sending a command, work here too. The platform checks each action against your own permissions.
Editing on the canvas
Edit turns the dashboard into a canvas. The buttons change to Add widget, Preview, Export, History, Save and Done, and a bar of layout settings appears.
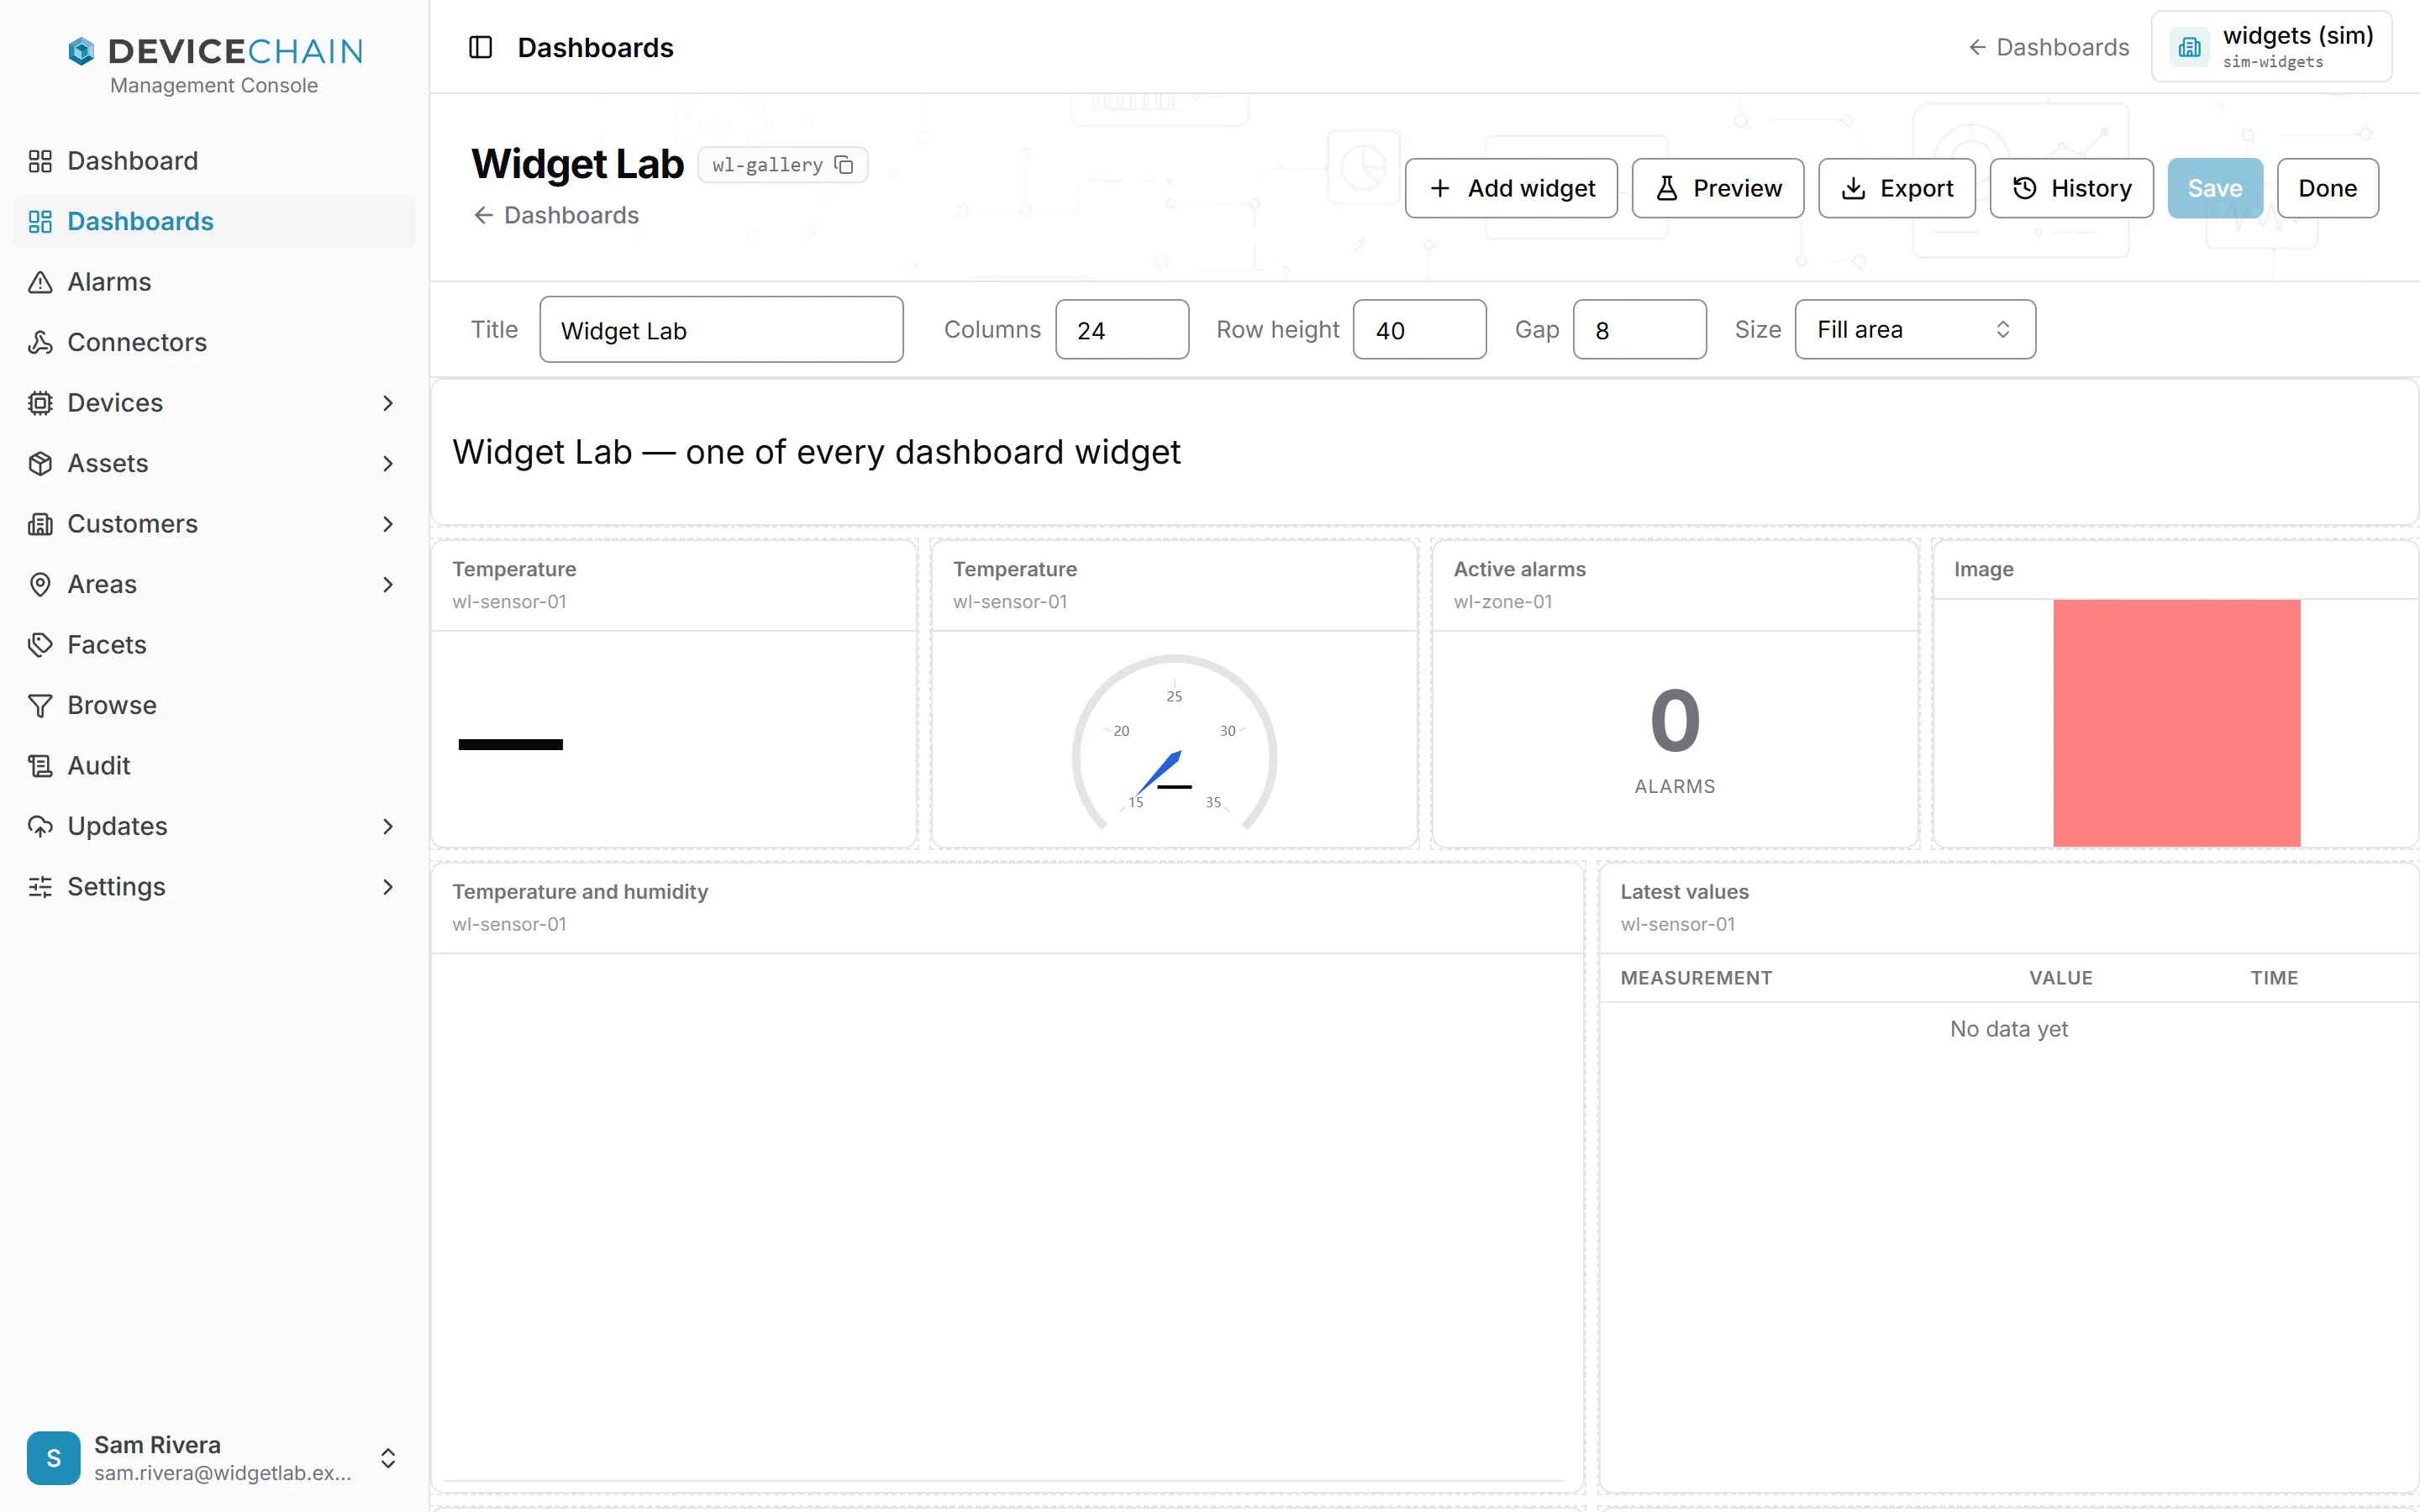
- Title is the dashboard's name.
- Columns, Min cell, Gutter and Padding set the grid widgets snap to. The cells are square and stretch to fill the width; Min cell is the smallest a cell may get, in pixels. Gutter is the space between cells and Padding the margin around the dashboard.
- Size decides how the dashboard fills the page: Fill area, Fixed width or Fixed height.
Drag a widget to move it and drag its edges to resize it. Widgets never overlap: a widget you move or resize onto others pushes them down out of its way, and a new widget goes in the first free space. A widget that has not received data yet shows a dash or No data yet.
A dashboard saved by an earlier release is converted to the current grid when it opens. The conversion is approximate, so the editor shows a note asking you to review the layout. Saving keeps the dashboard in the current format and removes the note.
Save stores your changes in the draft. It is greyed out until there is something to save. Done returns to the view; unsaved changes stay, and Save remains available there. If you close the tab or use the Dashboards back link with unsaved changes, the console asks before discarding them. Choosing another page in the sidebar does not ask, so save first. Saving changes the draft only. Viewers see nothing new until you publish a version.
Adding a widget
Add widget opens the widget menu, grouped by what each widget does.
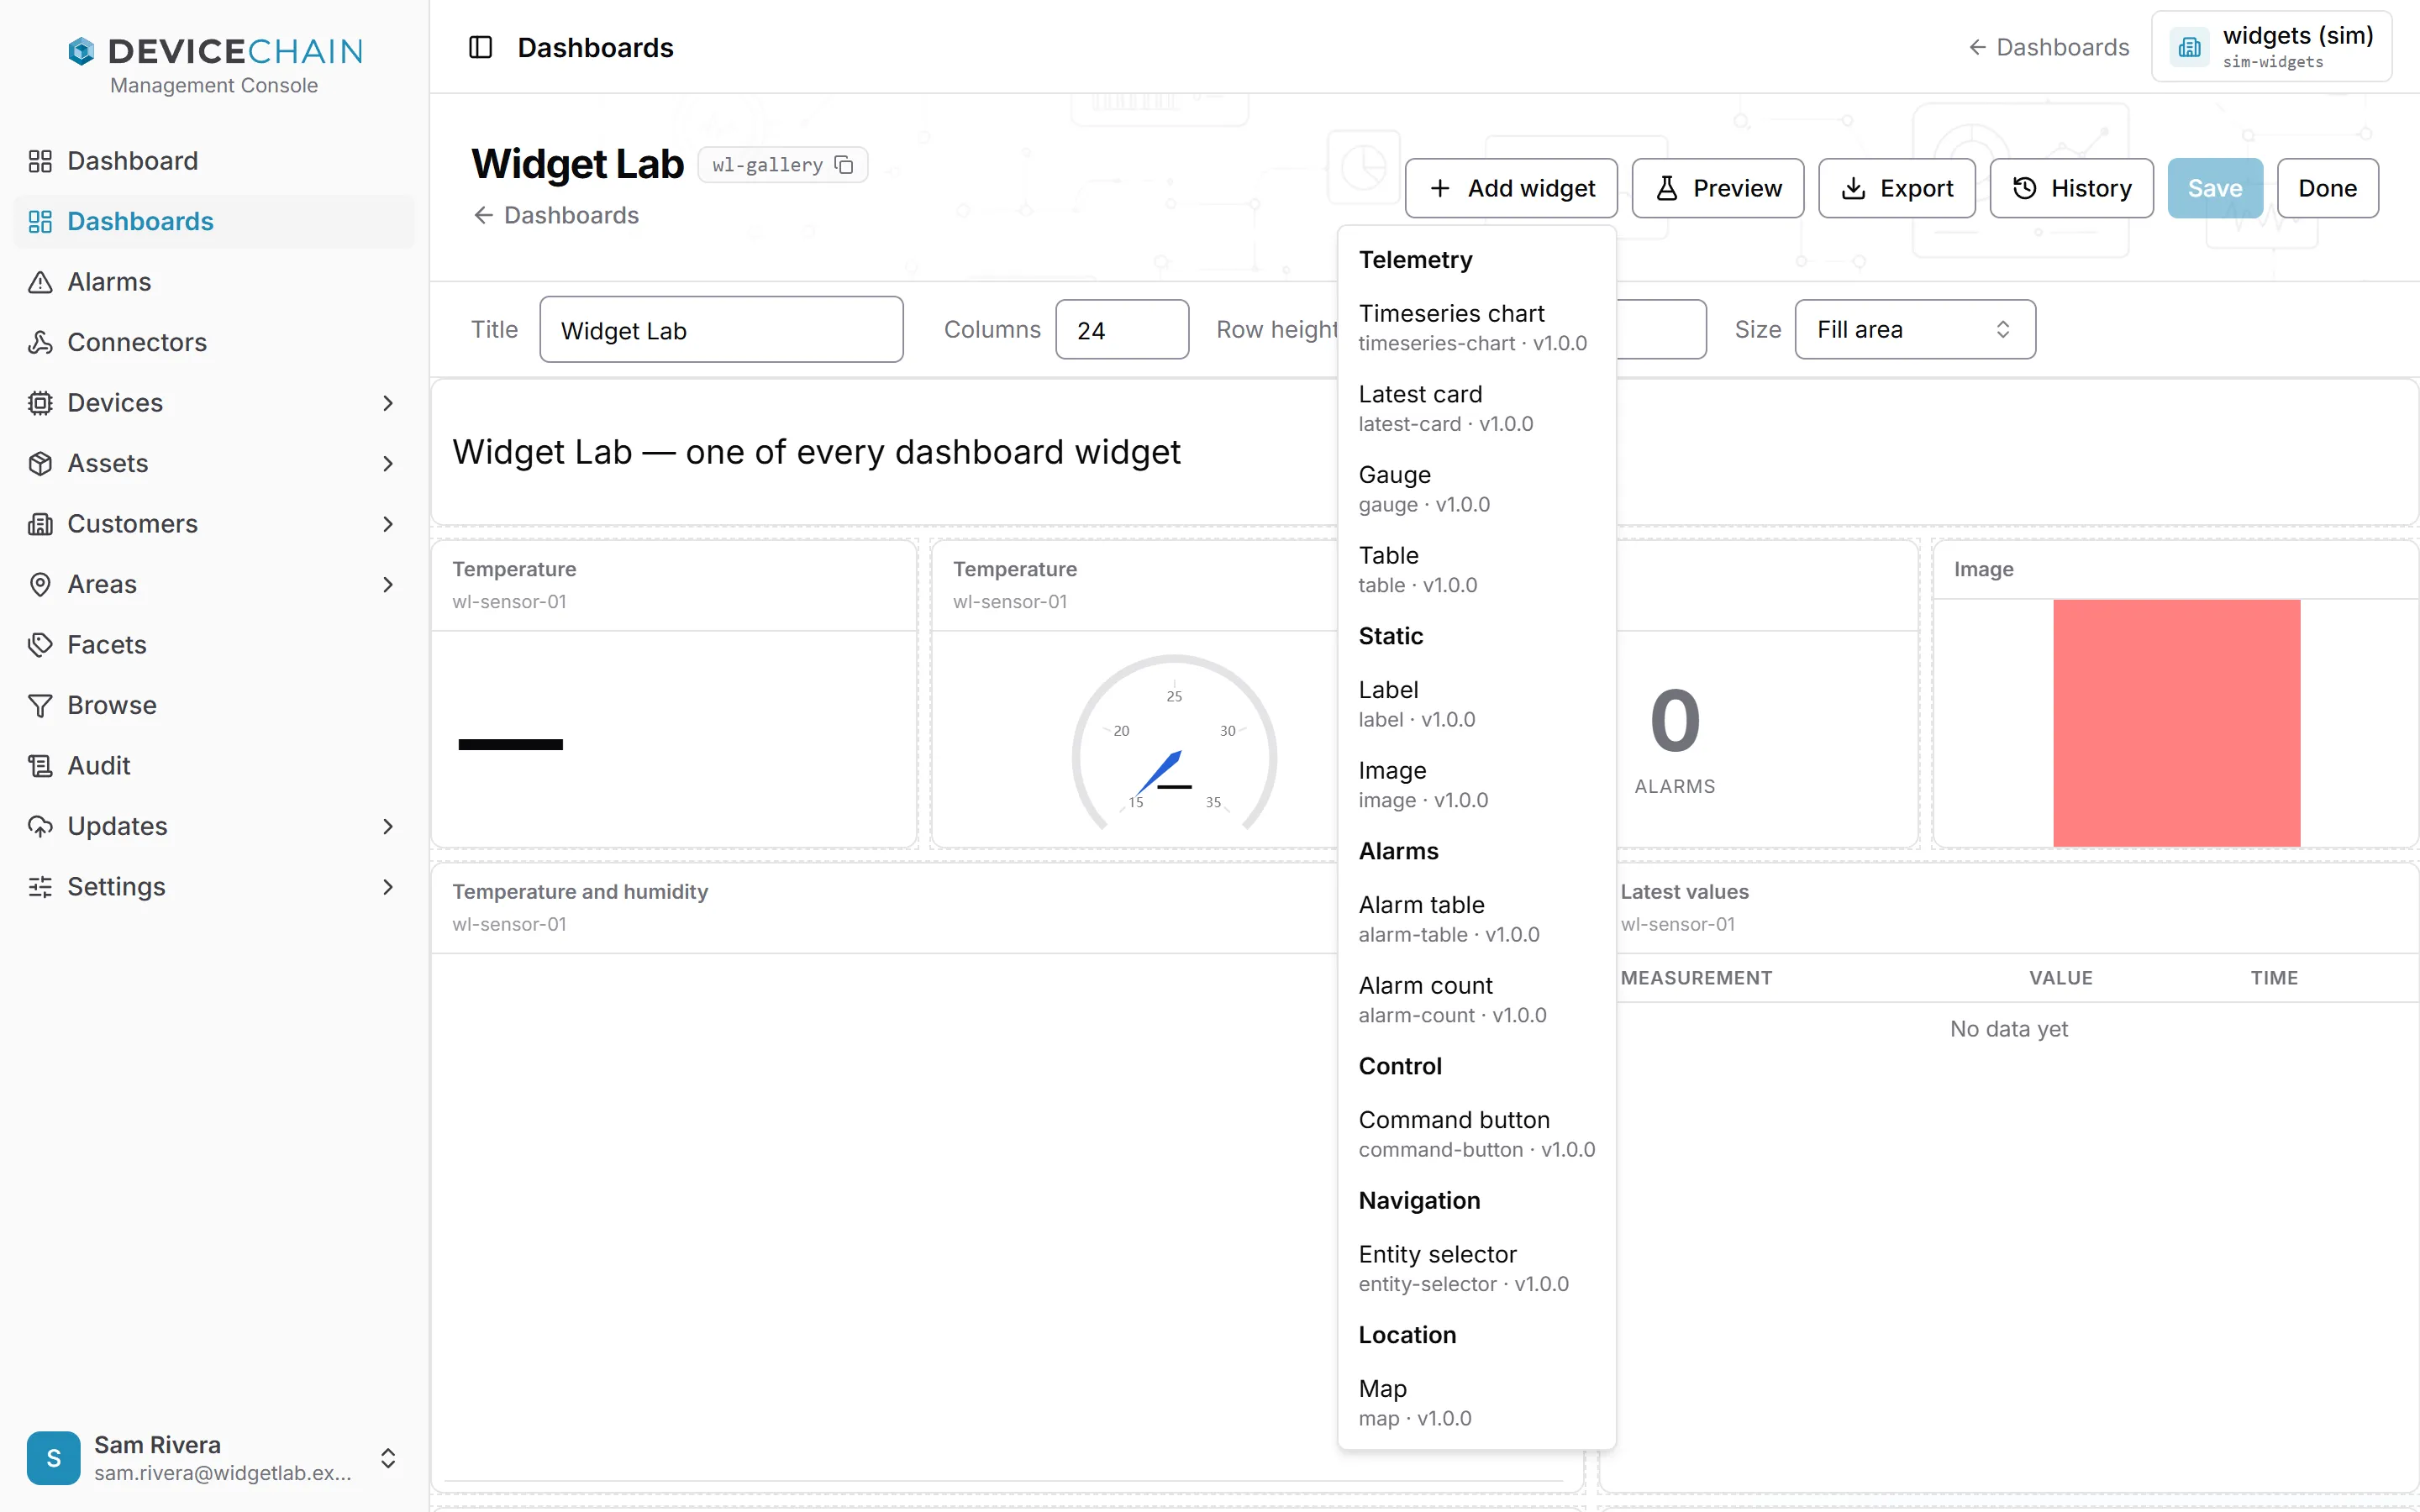
| Group | Widgets |
|---|---|
| Telemetry | Timeseries chart, Latest card, Gauge, Table, Linear gauge, Level gauge, Battery, Status light, Signal bars |
| Static | Label, Image |
| Alarms | Alarm table, Alarm count |
| Control | Command button |
| Navigation | Entity selector, which lets a viewer choose which device or entity the dashboard shows |
| Location | Map, which draws on the tenant's map (see Tenant settings) |
Choose one to add it to the canvas, then configure it.
Configuring a widget
Select a widget on the canvas to open its settings on the right. Front and Delete appear on the widget itself.
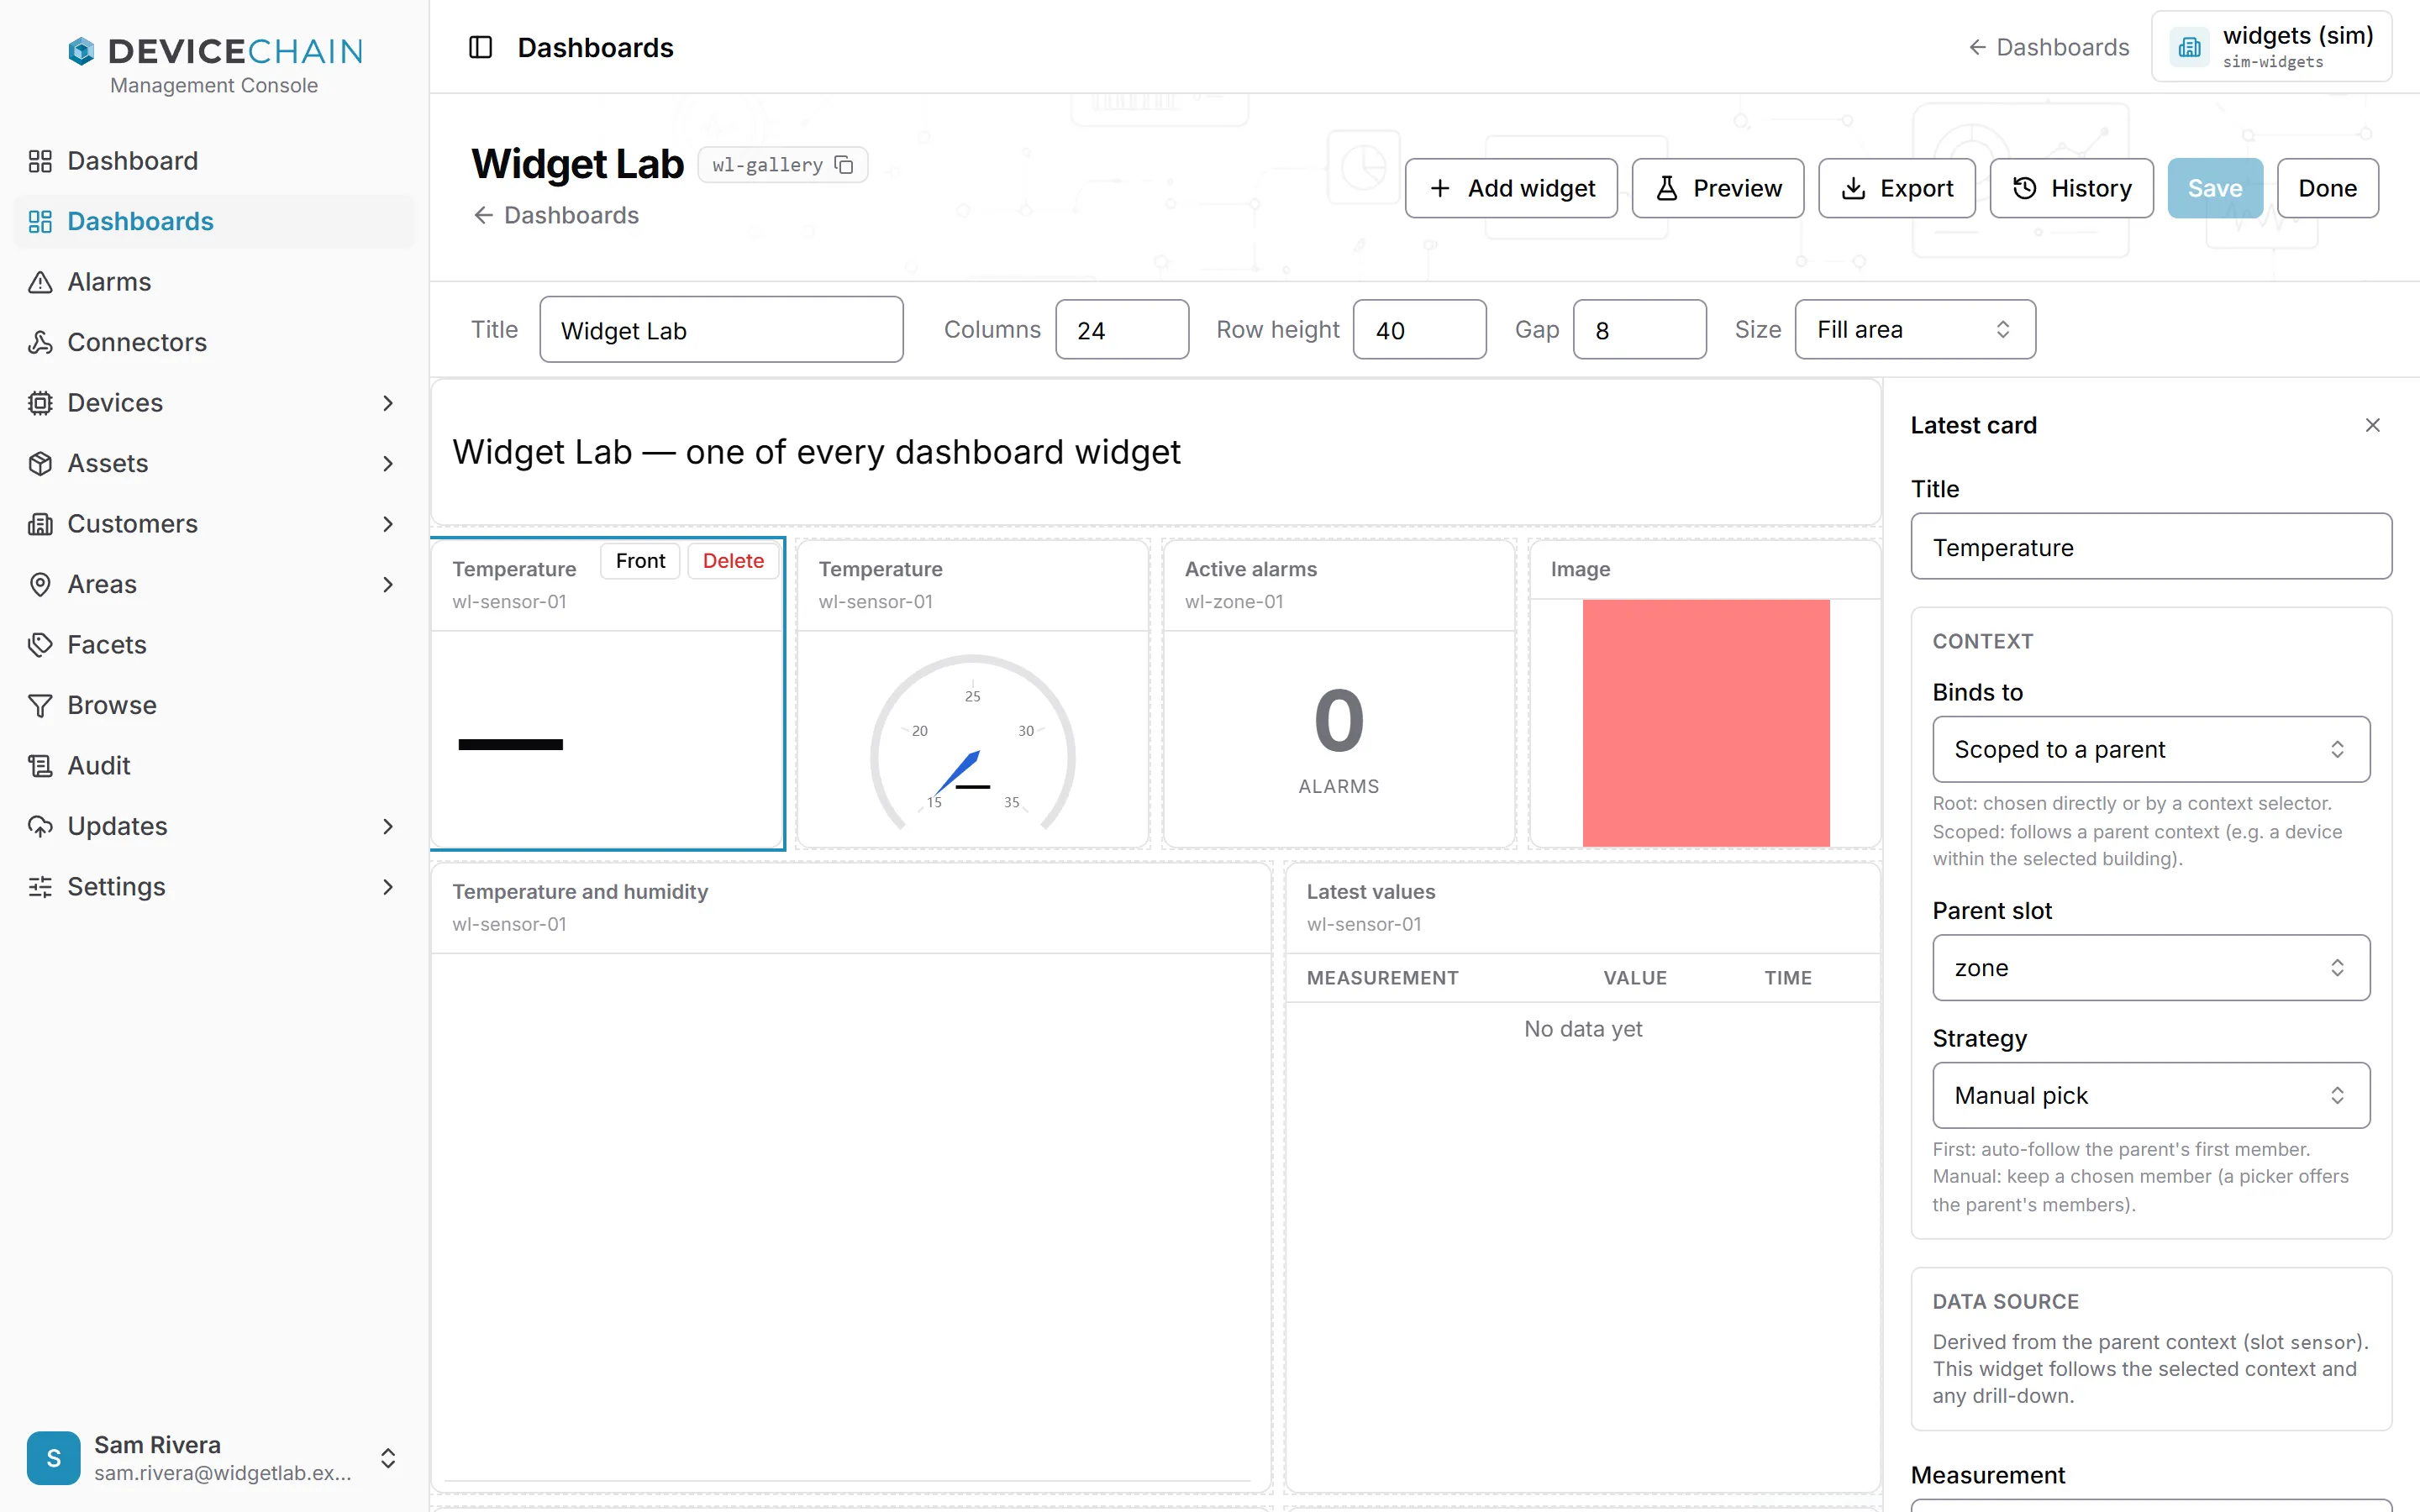
The settings depend on the widget. Common ones:
- Title shown on the widget.
- Context: what the widget is bound to. Root context binds it directly to a device or entity. Scoped to a parent makes it follow another widget's context, for example a device inside the building chosen elsewhere on the dashboard. With a parent, Strategy decides whether it follows the parent's First member or a member you choose (Manual pick).
- Data source picks the device or entity the widget reads. For a widget scoped to a parent, it explains that the widget follows the parent.
- Measurement and display options such as units, range, precision and how many samples to keep.
Problems with a widget's options, such as an option it does not read, a required one left empty or a value out of range, are listed in Version history. Publish version stays disabled until they are fixed.
Previewing with synthetic data
Preview replaces live data with generated values, so you can check scales, thresholds and layout before any device reports. A picker beside the button chooses the shape of the data: Sine wave, Ramp or Random walk. Preview works in both view and edit mode. Choose Preview again to go back to live data.
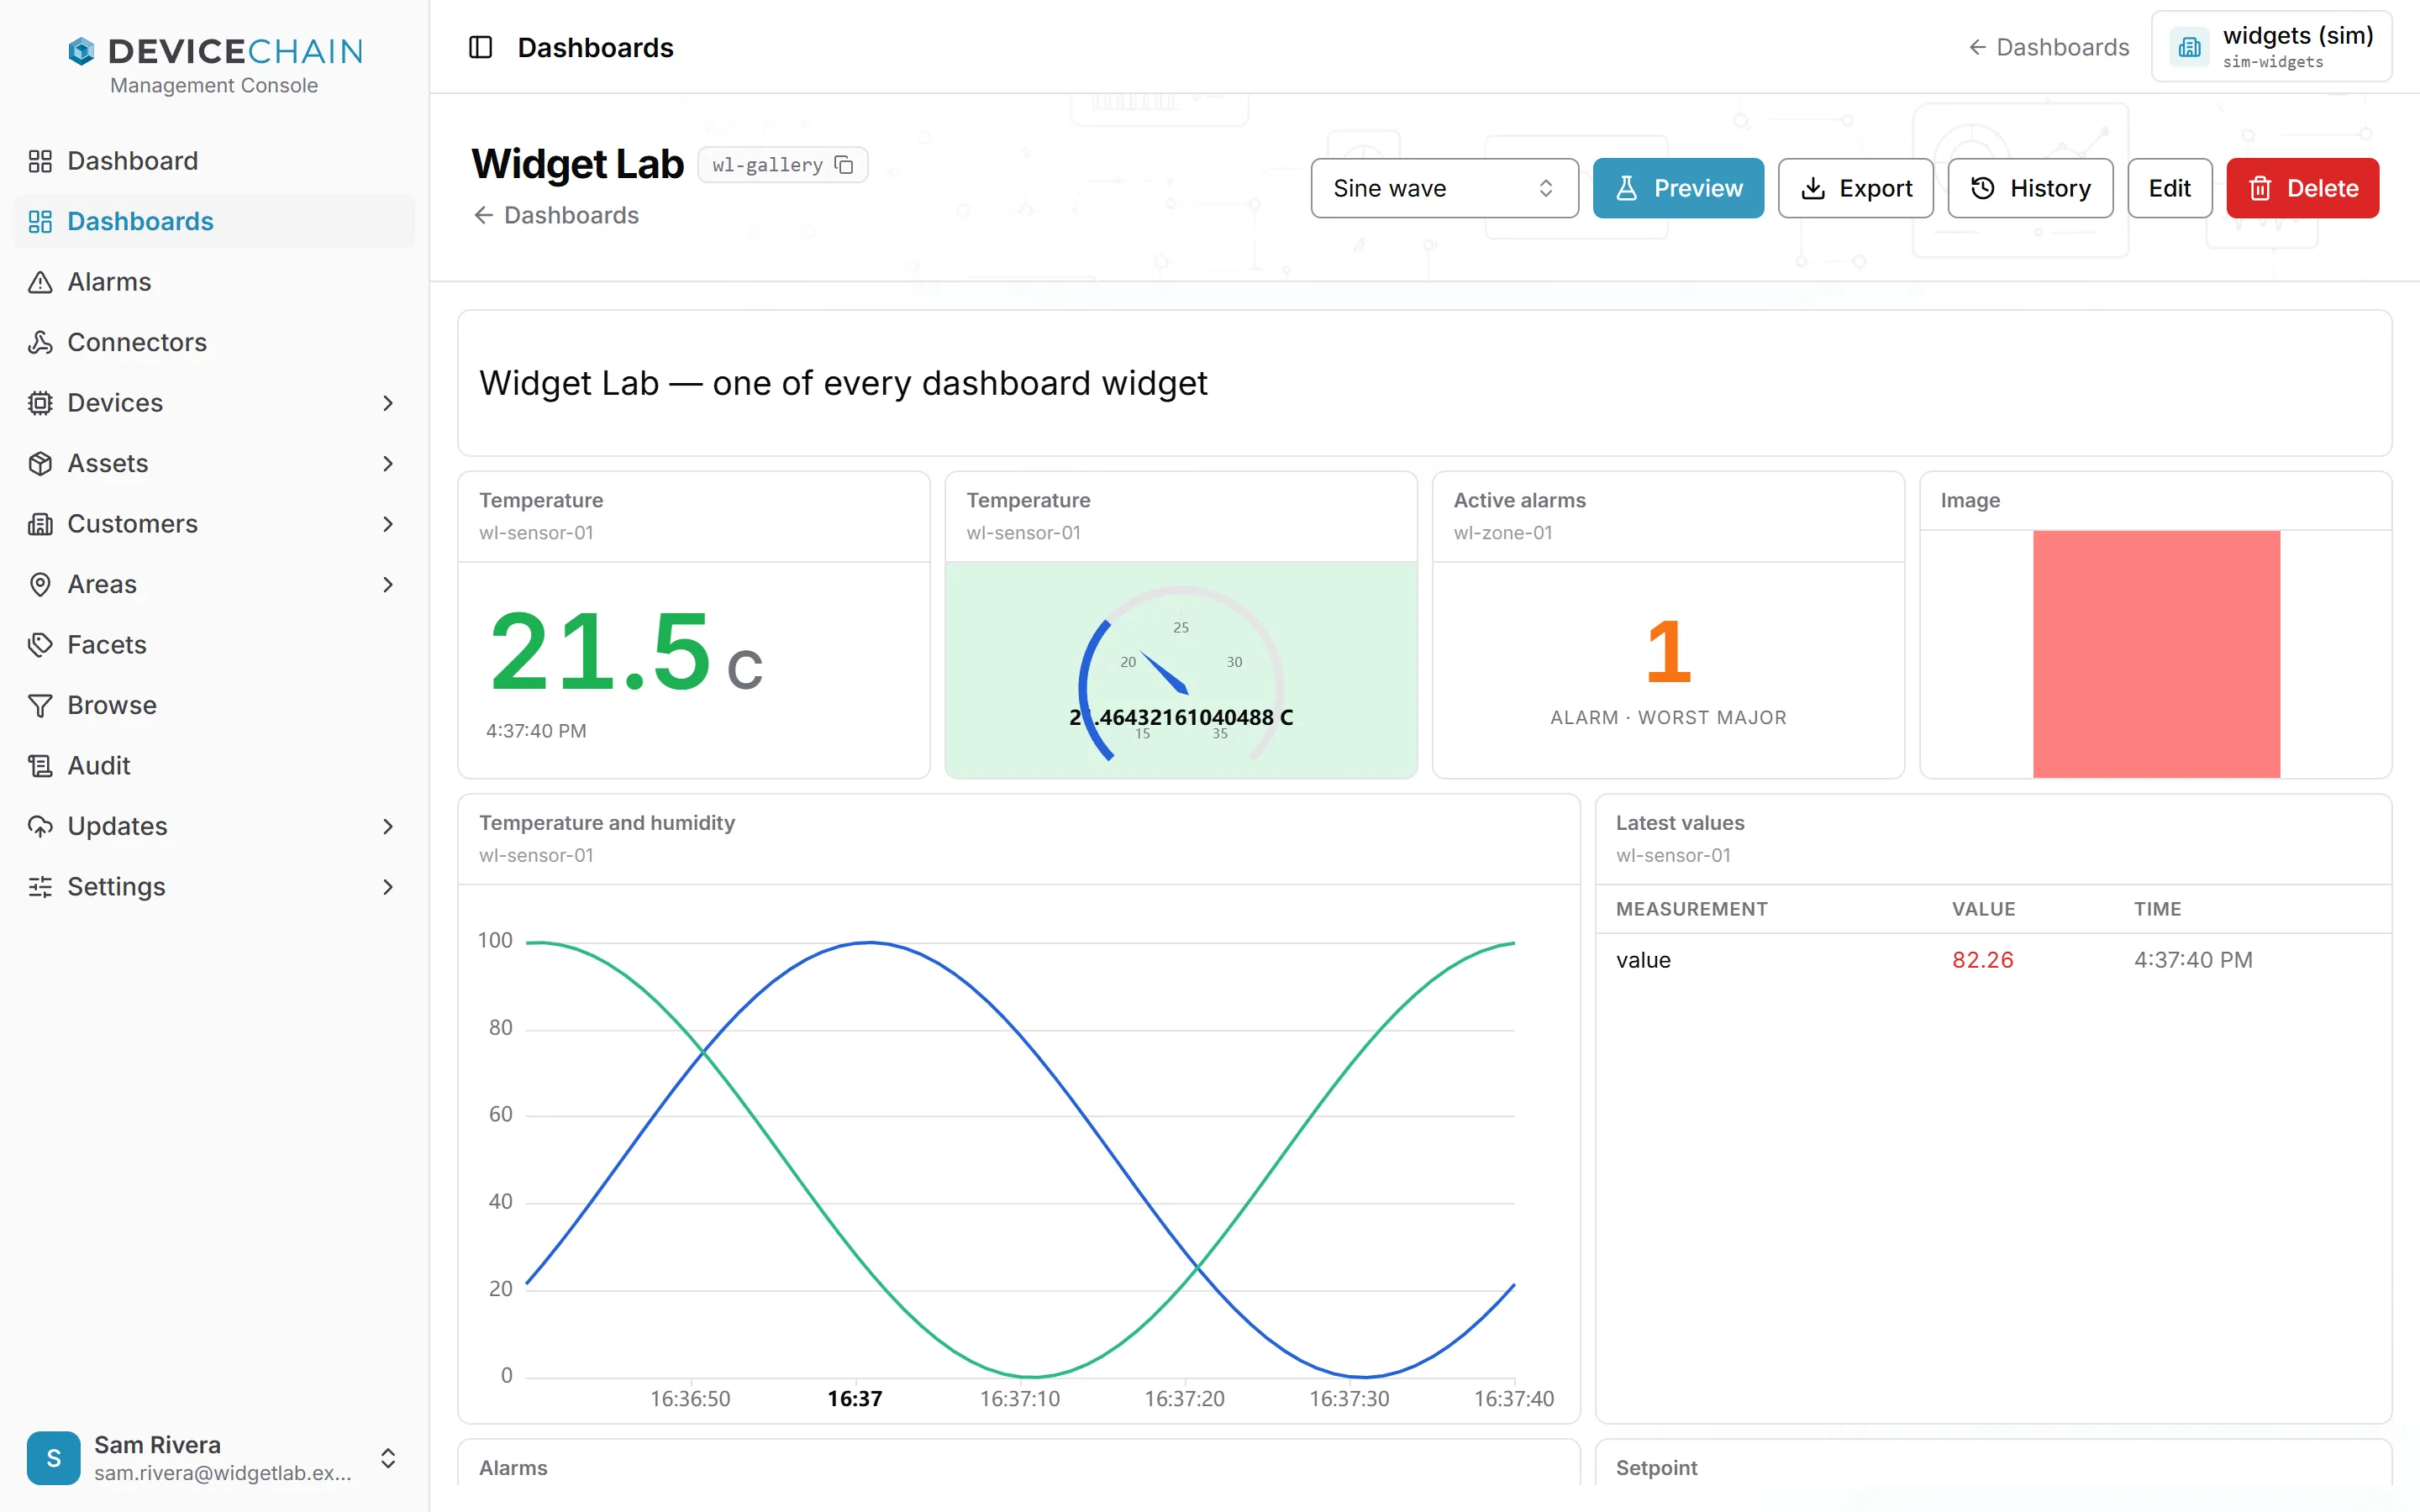
Generated data stays in your browser and is never saved.
Exporting
Export offers four choices.
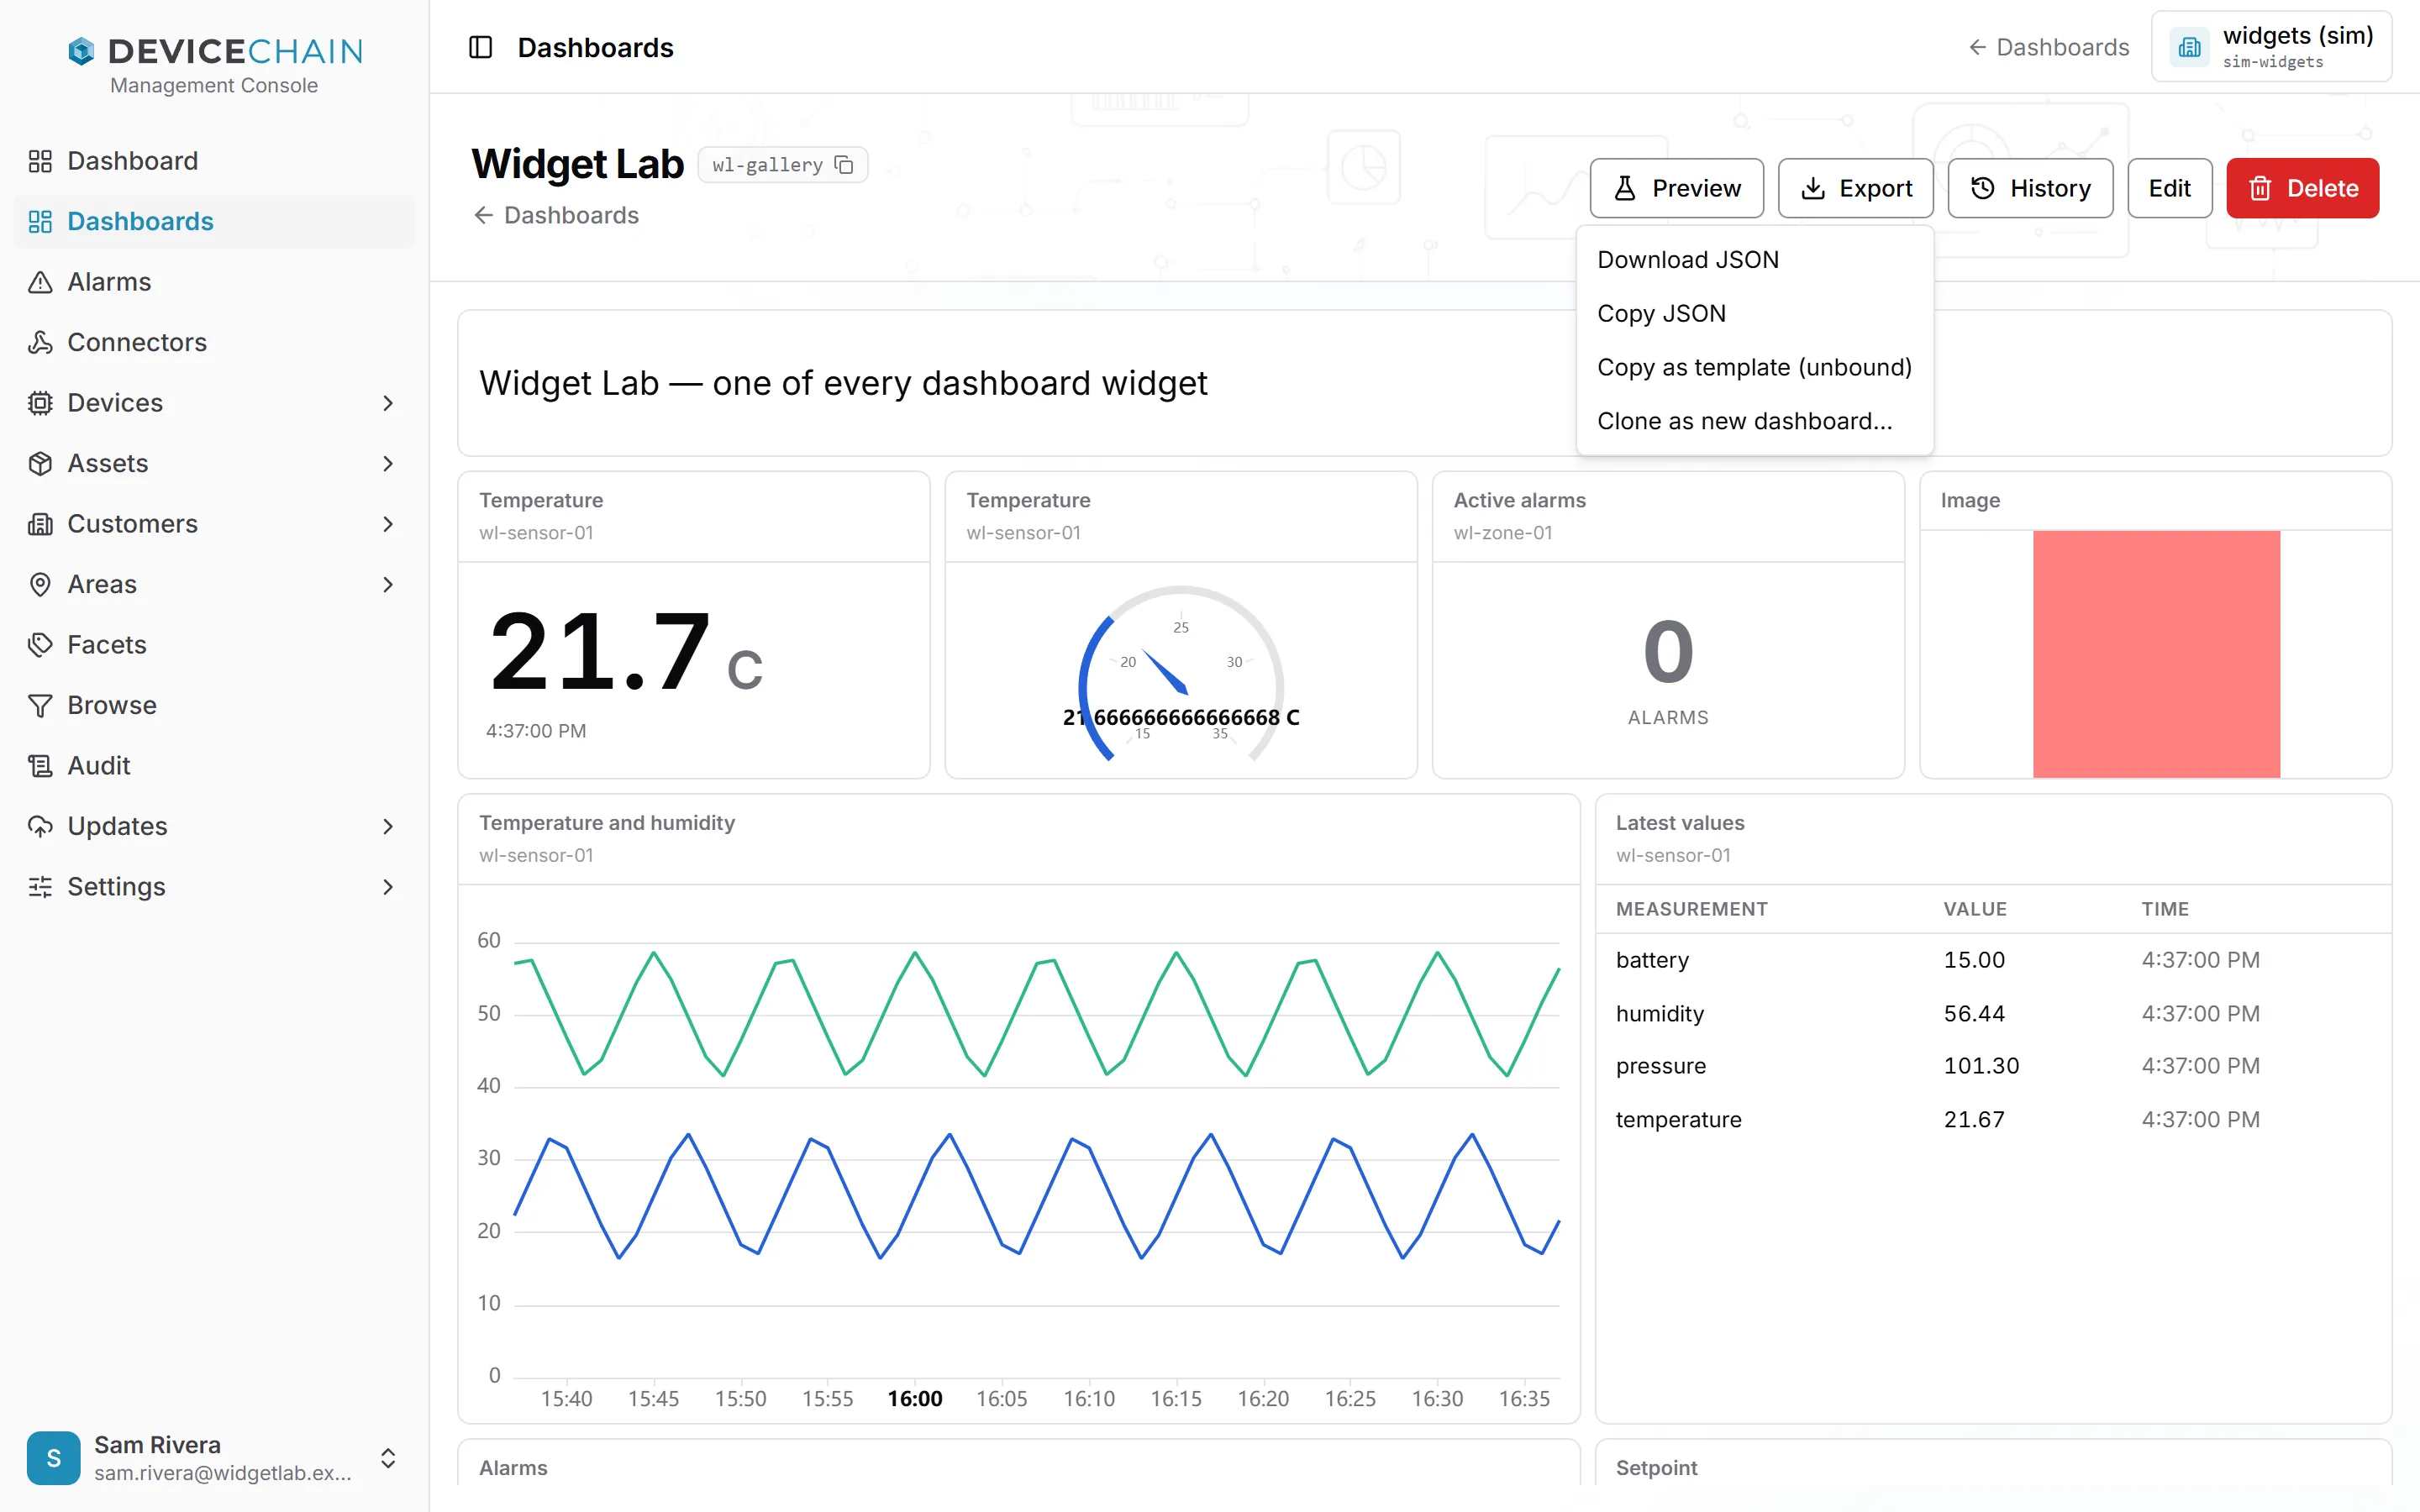
- Download JSON saves the dashboard as a file.
- Copy JSON copies it to the clipboard.
- Copy as template (unbound) copies it without its device and entity bindings, so whoever imports it picks their own.
- Clone as new dashboard… opens the import review with this dashboard, to create a copy under a new token.
Versions
History opens the version history. A dashboard's draft is what you edit; a version is a frozen copy of the draft that viewers are shown.
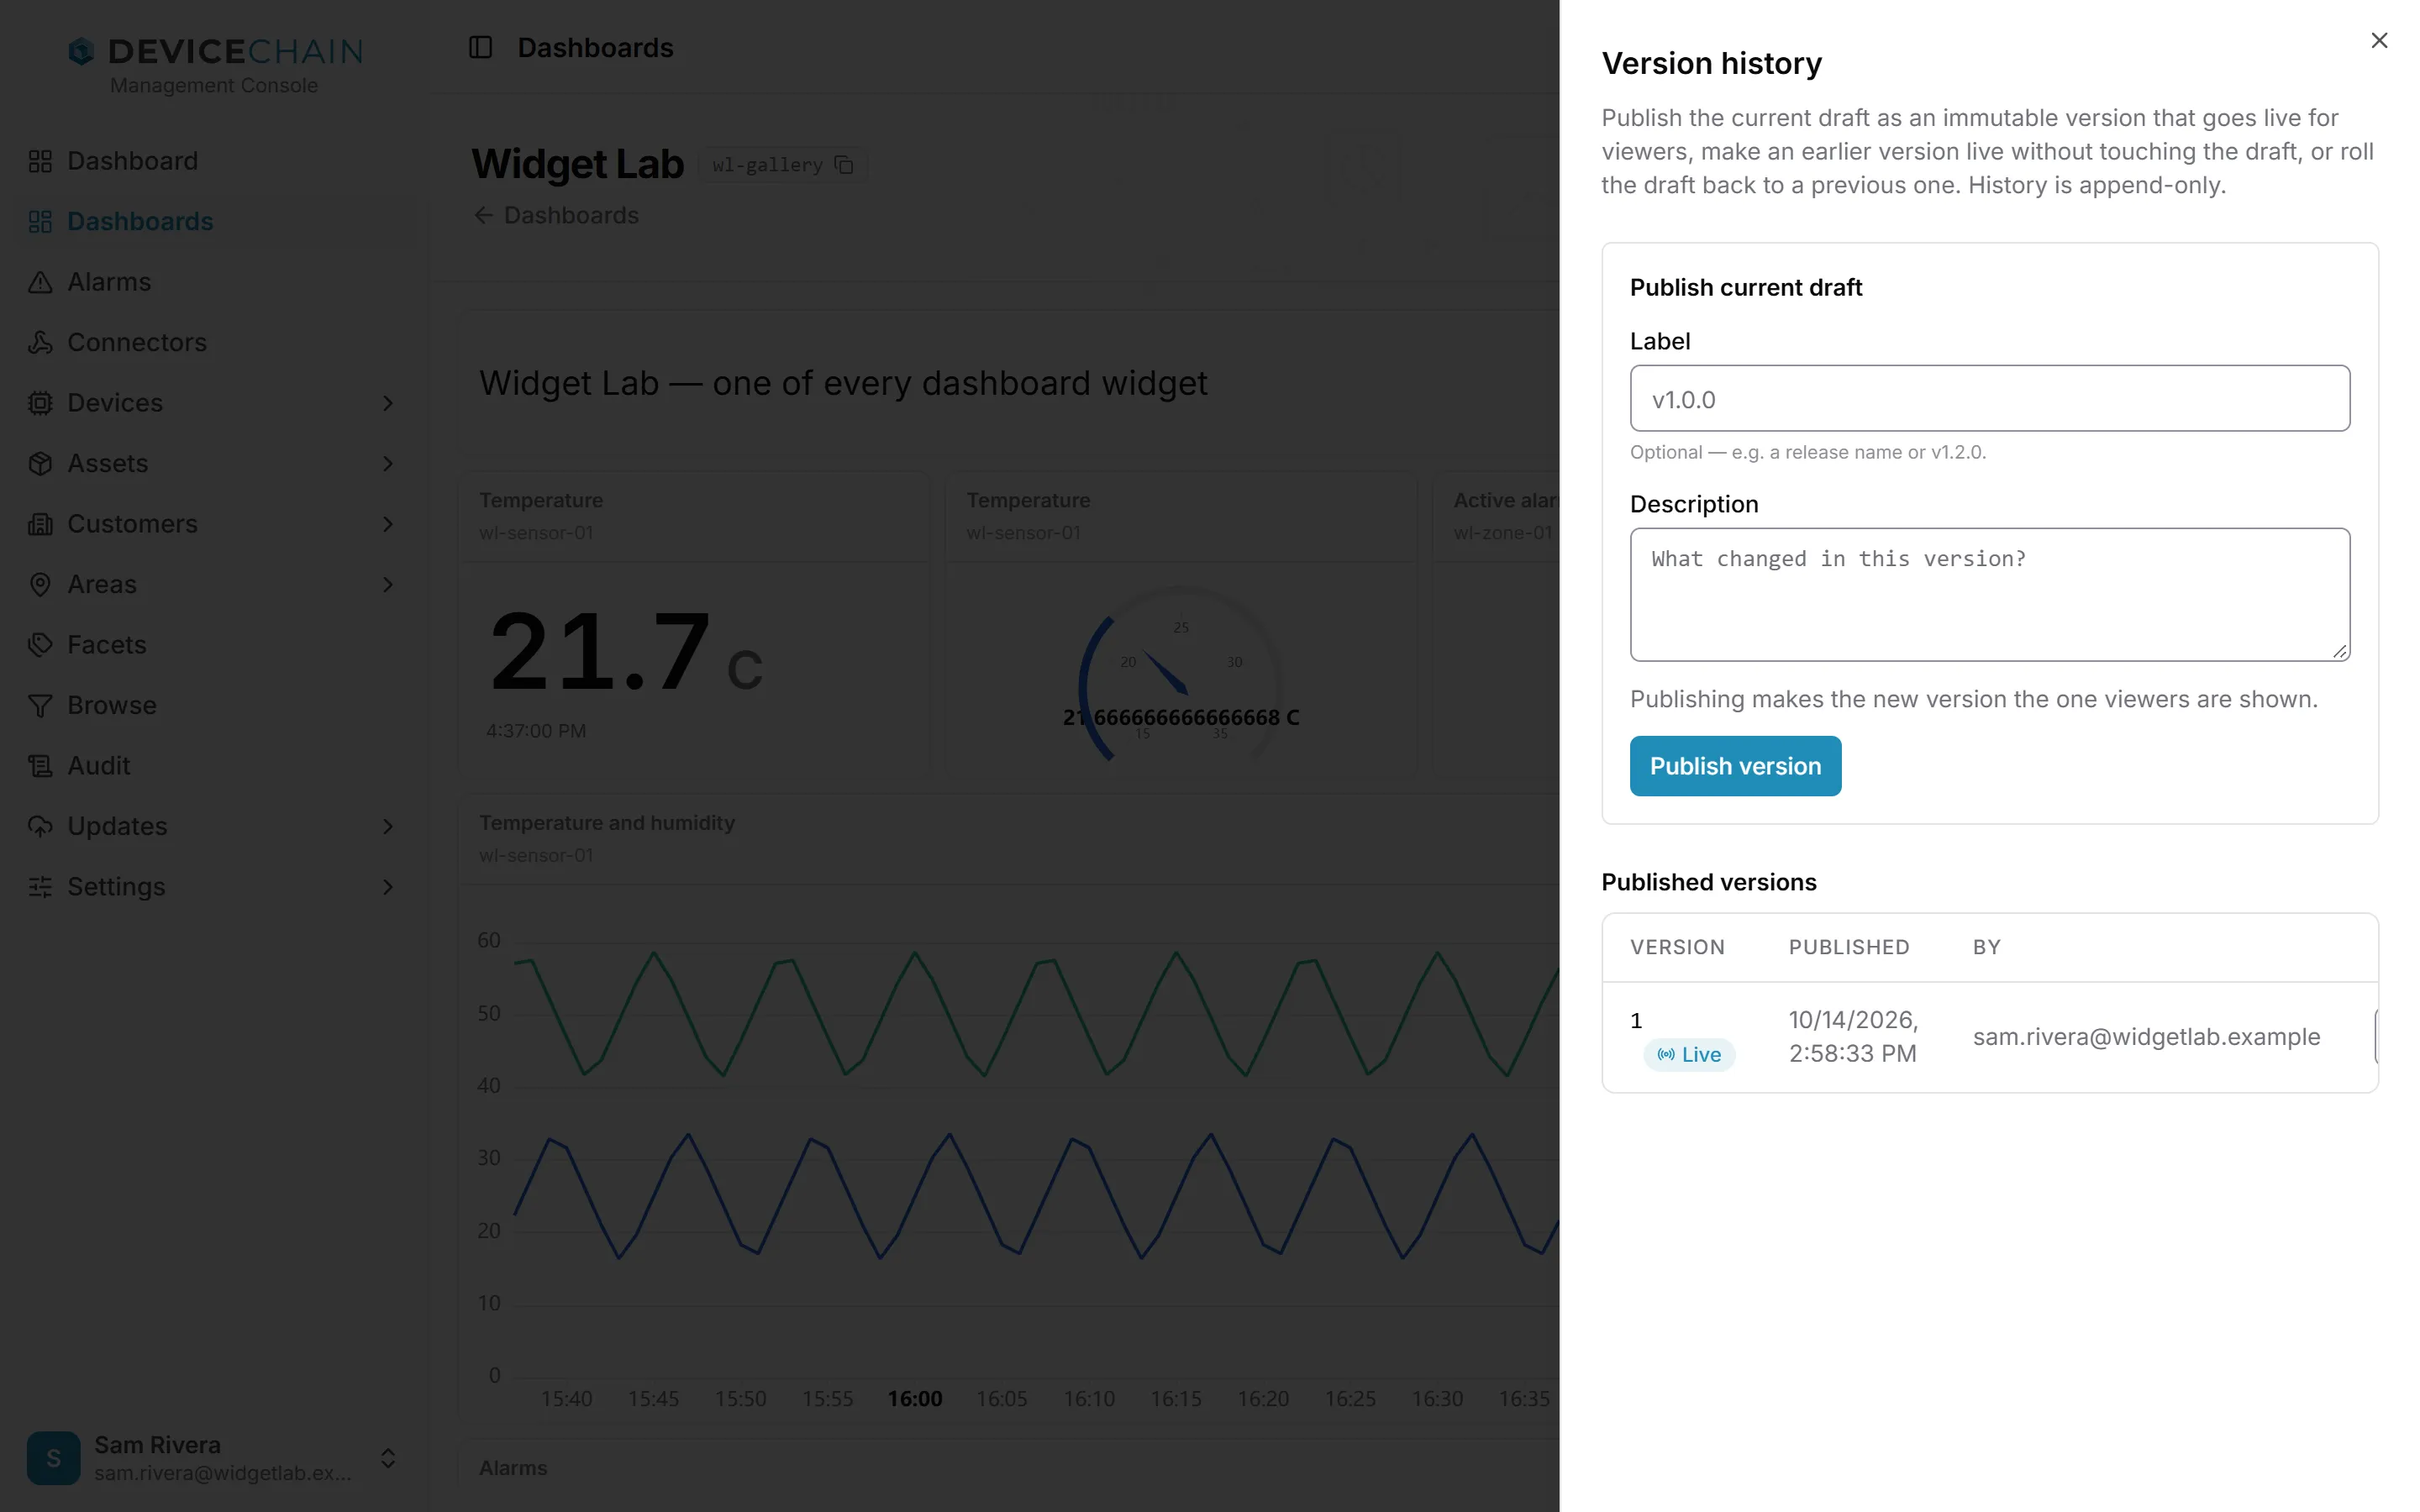
- Publish current draft. Add an optional label, such as a release name, and a description, then choose Publish version. The new version goes live straight away. Save your changes first: the console publishes the saved draft.
- Published versions lists each version with when and by whom it was published. The live one is marked Live.
- Make live serves an earlier version to viewers without touching your draft.
- Roll back replaces the draft with an earlier version. Anything in the draft that you had not published is lost, and the console asks you to confirm.
History only grows. Publishing, making a version live and rolling back each leave the earlier versions in place.
Related
- Dashboards: widgets, data sources, versioning and embedding
- Basemaps, for the map widget's tiles