Detection rules
A detection rule watches the telemetry of one device profile and acts when something happens: a reading crosses a limit, a device goes quiet, a value climbs too fast. When a rule fires it can raise an alarm, send a command back to the device, call a webhook or publish to a connector.
This chapter is for anyone who writes or maintains rules. It covers the rule list, the three ways to author a rule (the form, the canvas and a plain-language description), previewing a rule against recorded history, and the Rule Health tab that tells you whether published rules are firing. For the rule types and actions in depth, see Event processing and alarms.
Rules belong to a device profile, and you edit the profile's draft. A new or changed rule reaches live telemetry only when you publish the profile from its Versions tab, which the Device types and profiles chapter covers.
The rule list
Open a device profile from Devices → Device Profiles and choose the Detection Rules tab. The list shows each rule's name, its type and whether it is enabled. Edit opens a rule, and the bin icon deletes it after you confirm. New detection rule starts a new one.
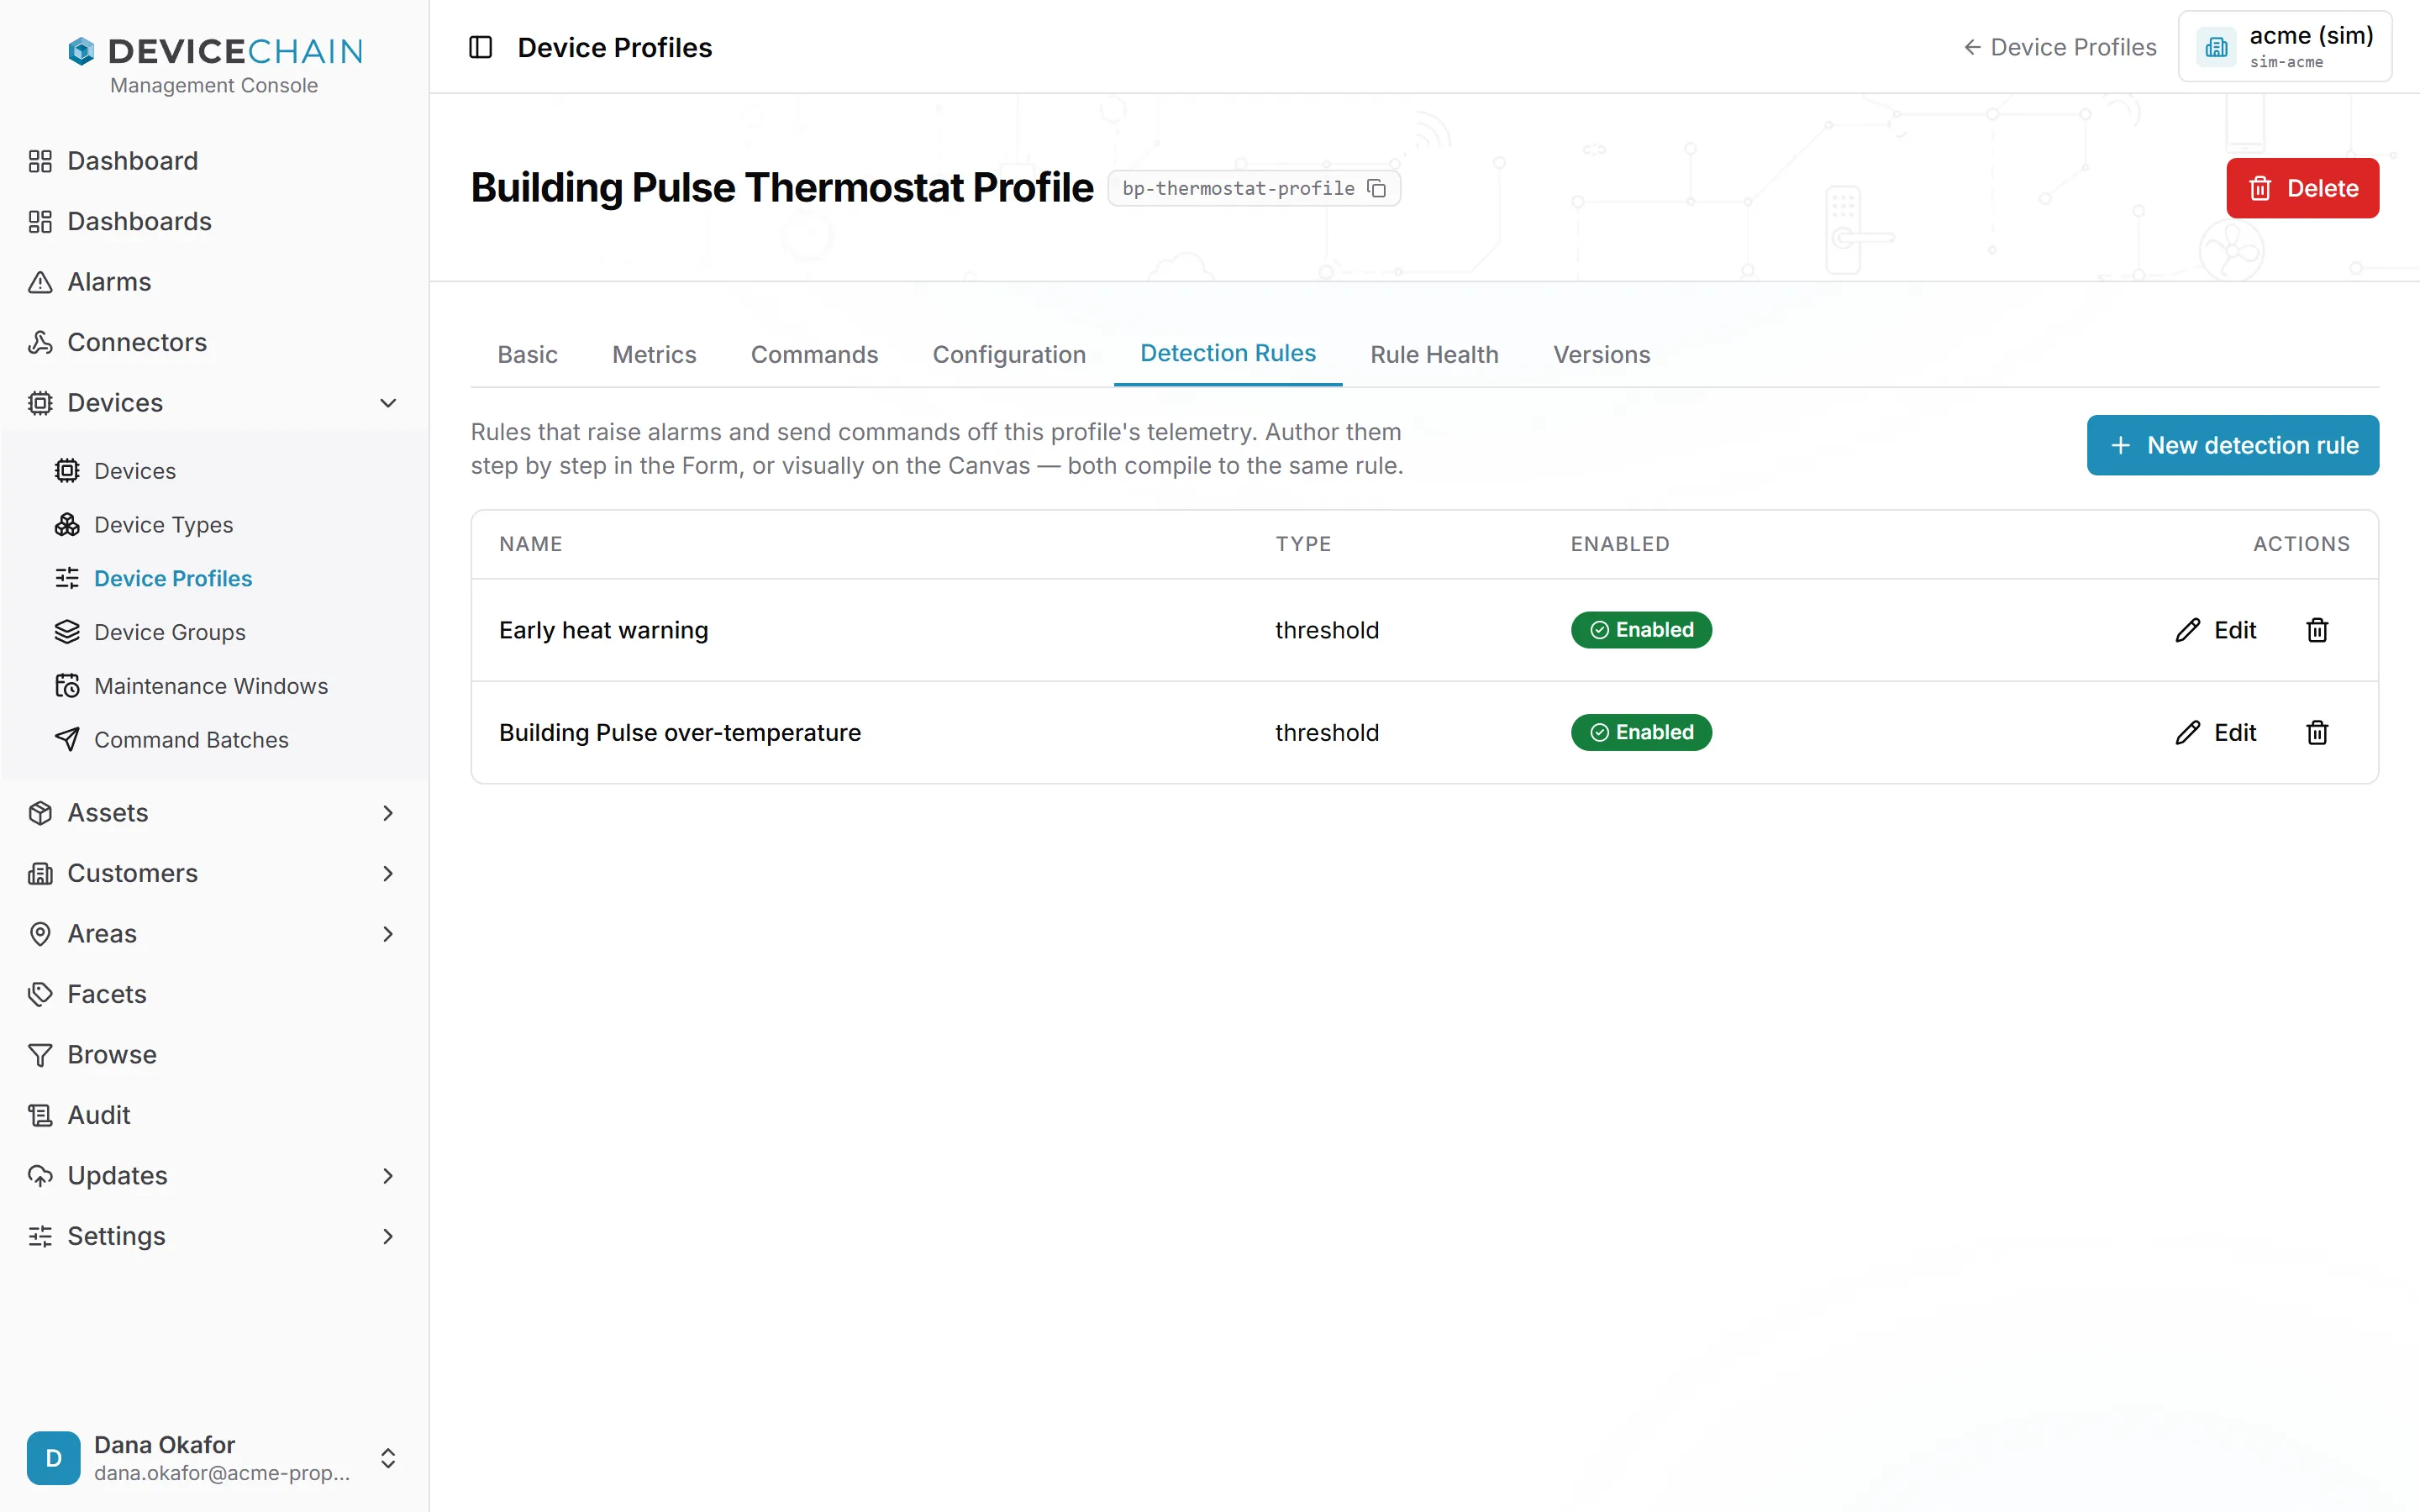
A disabled rule stays with the profile but does not run. Use that to park a rule rather than delete it.
Choosing how to author a rule
New detection rule opens a drawer with three modes at the top: Form, Canvas and Describe. All three produce the same kind of rule, and the same compiler checks it. When you edit an existing rule you get Form and Canvas only; Describe is for new rules. A rule built on the canvas opens on the canvas when you edit it.
Authoring in the form
The form is the quickest way to write a single rule. You fill in a name, an optional description, a token (the rule's permanent id), the Rule type and a Severity, then the fields that rule type needs.
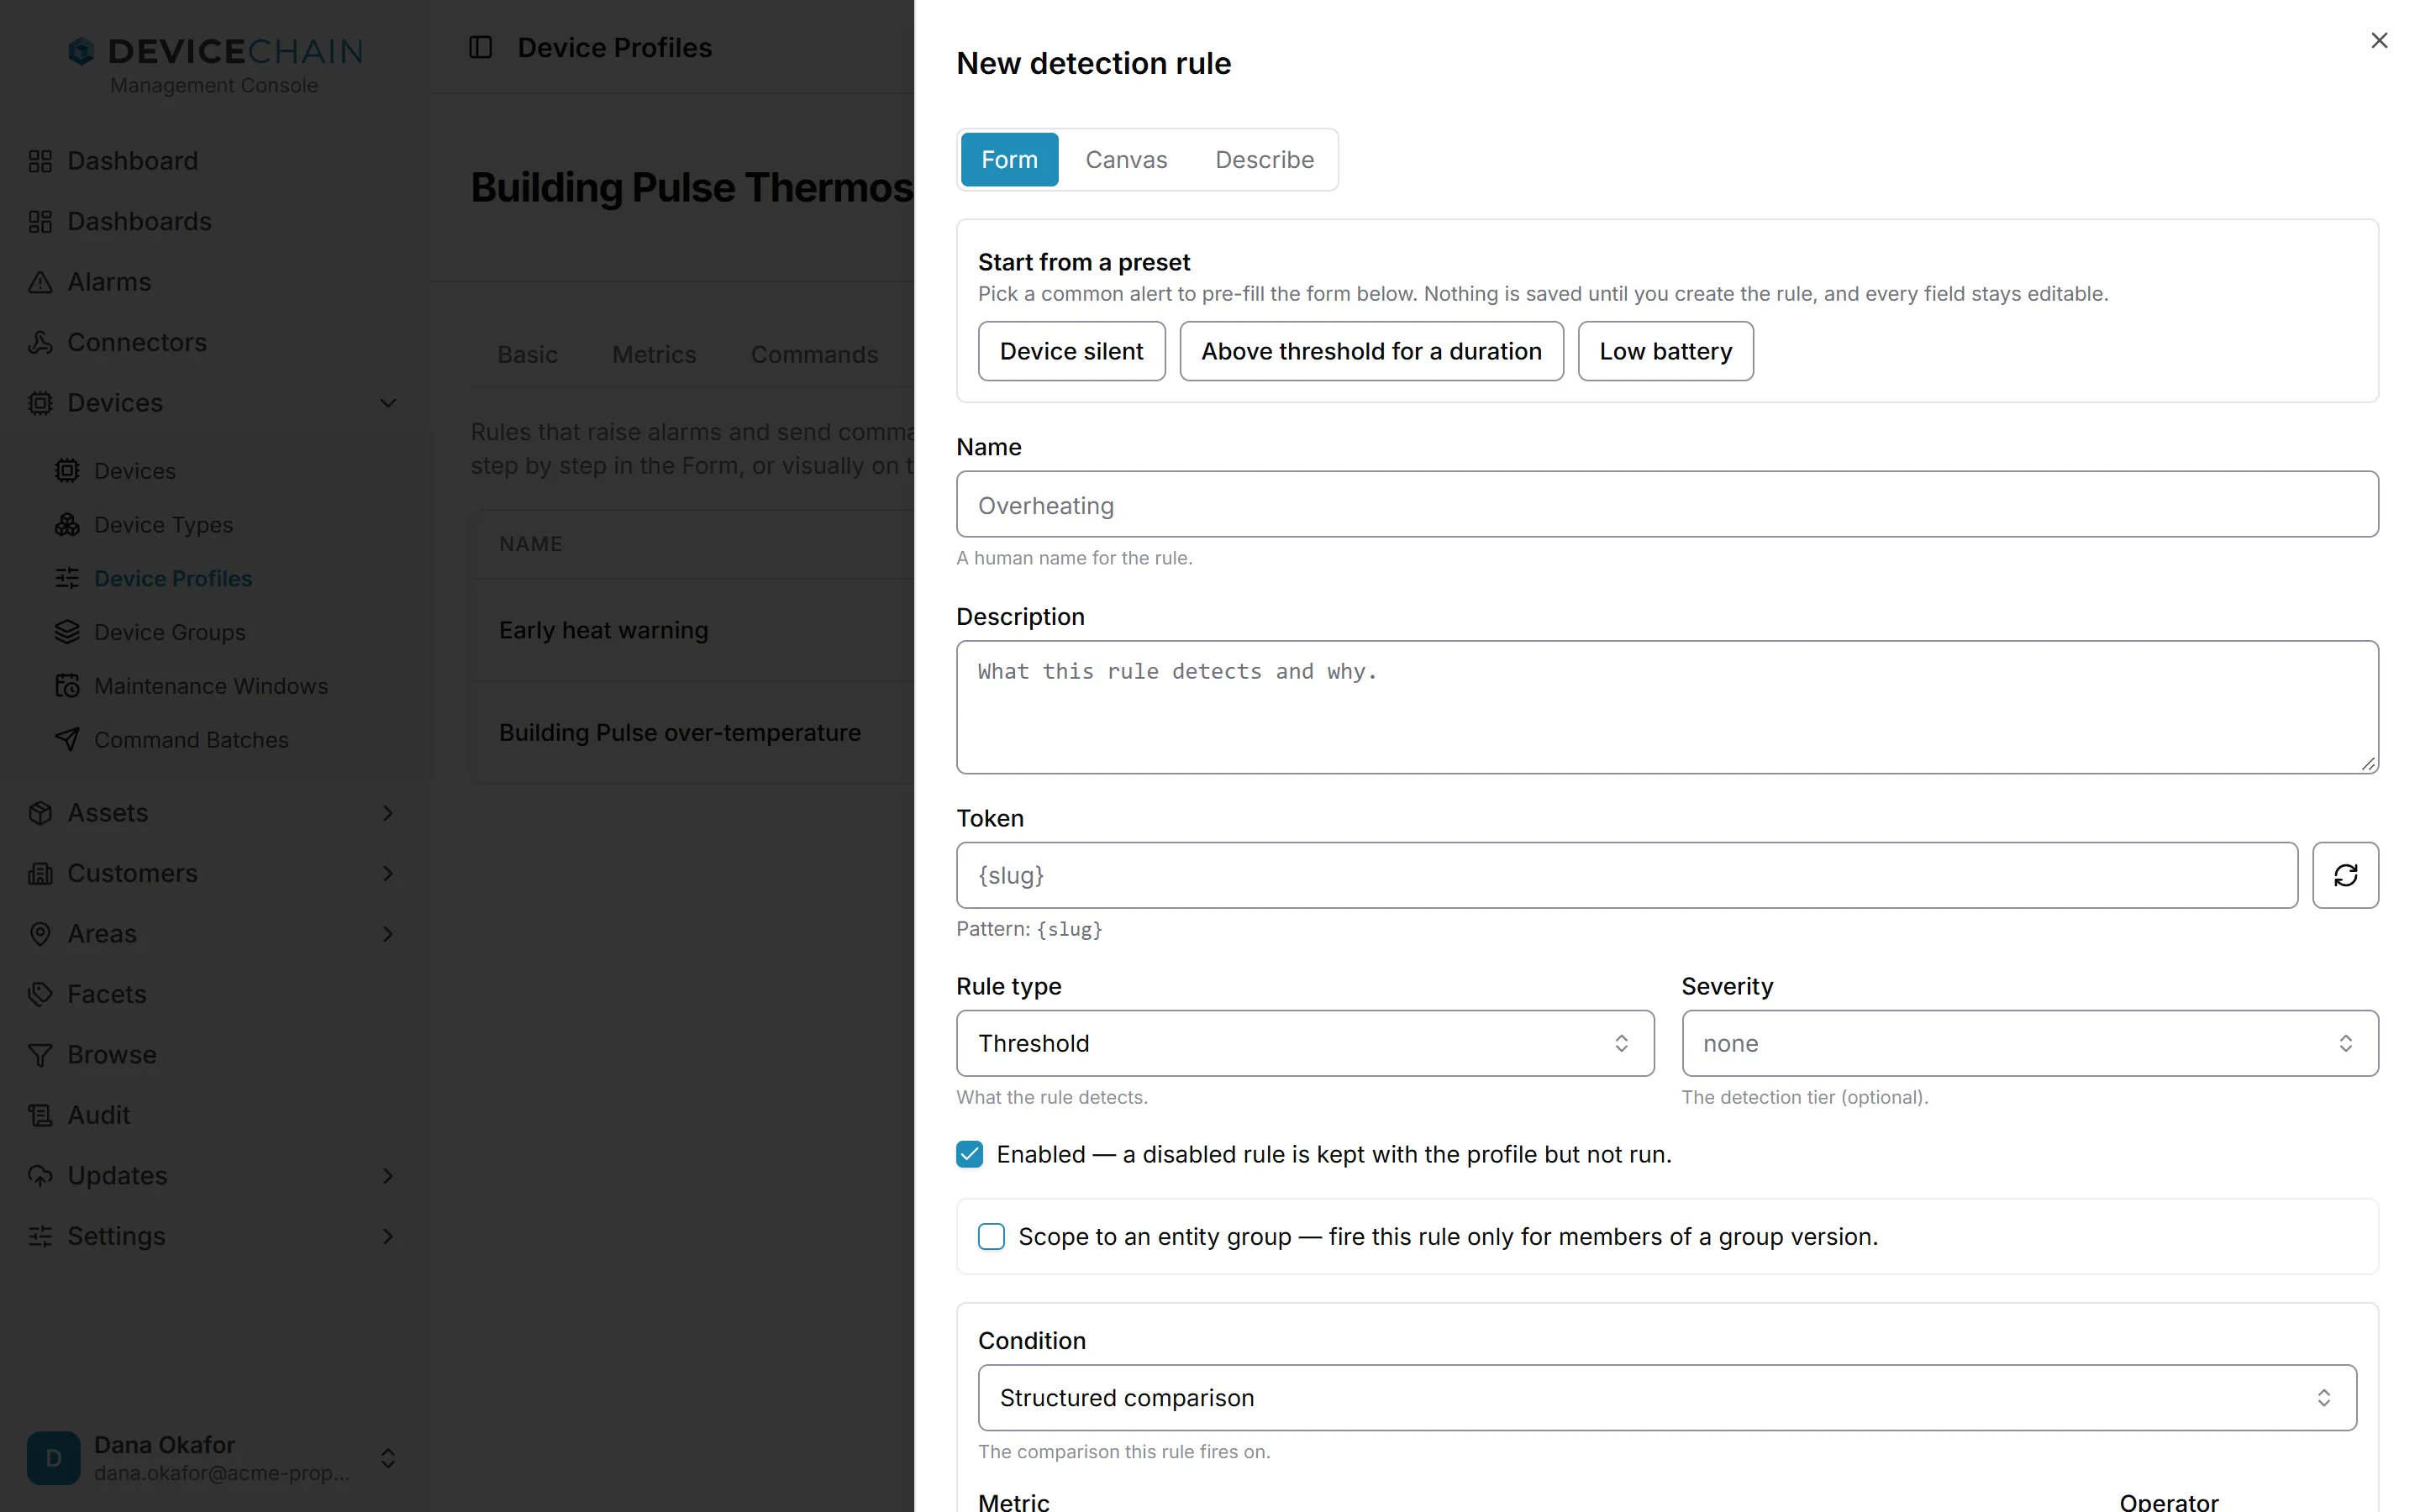
The parts of the form, from top to bottom:
- Start from a preset fills the form with a common alert. It is described in the next section.
- Rule type decides what the rule detects: Threshold, Duration, Absence, Connectivity, Windowed aggregate, Rate of change, Repeating or Area correlation. Each type shows its own fields. The condition types section explains each one.
- Severity is optional unless the rule raises an alarm, in which case the alarm carries it.
- Enabled turns the rule on or off without deleting it.
- Scope to an entity group limits the rule to the members of one published version of a dynamic group. Absence and correlation rules cannot be scoped this way.
- Condition is the comparison the rule fires on: a structured comparison of a metric against a value or a device attribute, an advanced CEL expression, or, for some types, Match every event. Absence and Connectivity rules have no condition.
- Actions is what happens when the rule fires: Raise alarm, Send command, Call a webhook or Publish to a connector. A rule with no action raises no alarm. Area correlation rules cannot carry actions.
As you type, the form asks the compiler whether the rule is valid and shows the answer under the fields, for example The rule compiles. ✓ or the compiler's error. Below that sit a Preview against history panel (see Previewing against history) and, for a rule that raises an alarm, a Notifications check. Create detection rule saves the rule to the profile's draft.
Start from a preset
The preset row offers three alerts that most fleets need:
- Device silent raises an alarm when a device on the profile stops reporting for 15 minutes.
- Above threshold for a duration raises an alarm when a metric stays above a limit for 10 minutes. You choose the metric and the limit.
- Low battery raises an alarm when the battery level stays below 20% for 10 minutes.
Picking a preset fills the form. Nothing is saved until you create the rule, and every field stays editable. For the two presets that watch a metric, the form asks you to check the metric before you create the rule. The preset table lists the exact values each one fills in.
Will anyone be notified?
When the rule raises an alarm with a severity, the Notifications panel checks whether an enabled notification policy sends alarms of that severity through a working channel. It answers Covered or Not covered.
Policies route alarms by severity, not by rule. If nothing is covered, Create a policy for severity adds one on the spot: you pick a channel and, for email, the recipients. That policy then sends every alarm of that severity in the tenant, from any rule. You need a delivery channel first; see Configuring notification channels.
The button appears only if you can manage notification policies. The check is advisory. It never stops you saving the rule.
Authoring on the canvas
The canvas shows a rule as a small flow: a Source (the profile's telemetry) wired into a condition, and the condition wired into one or more actions. It suits rules that branch or reuse a computed value.
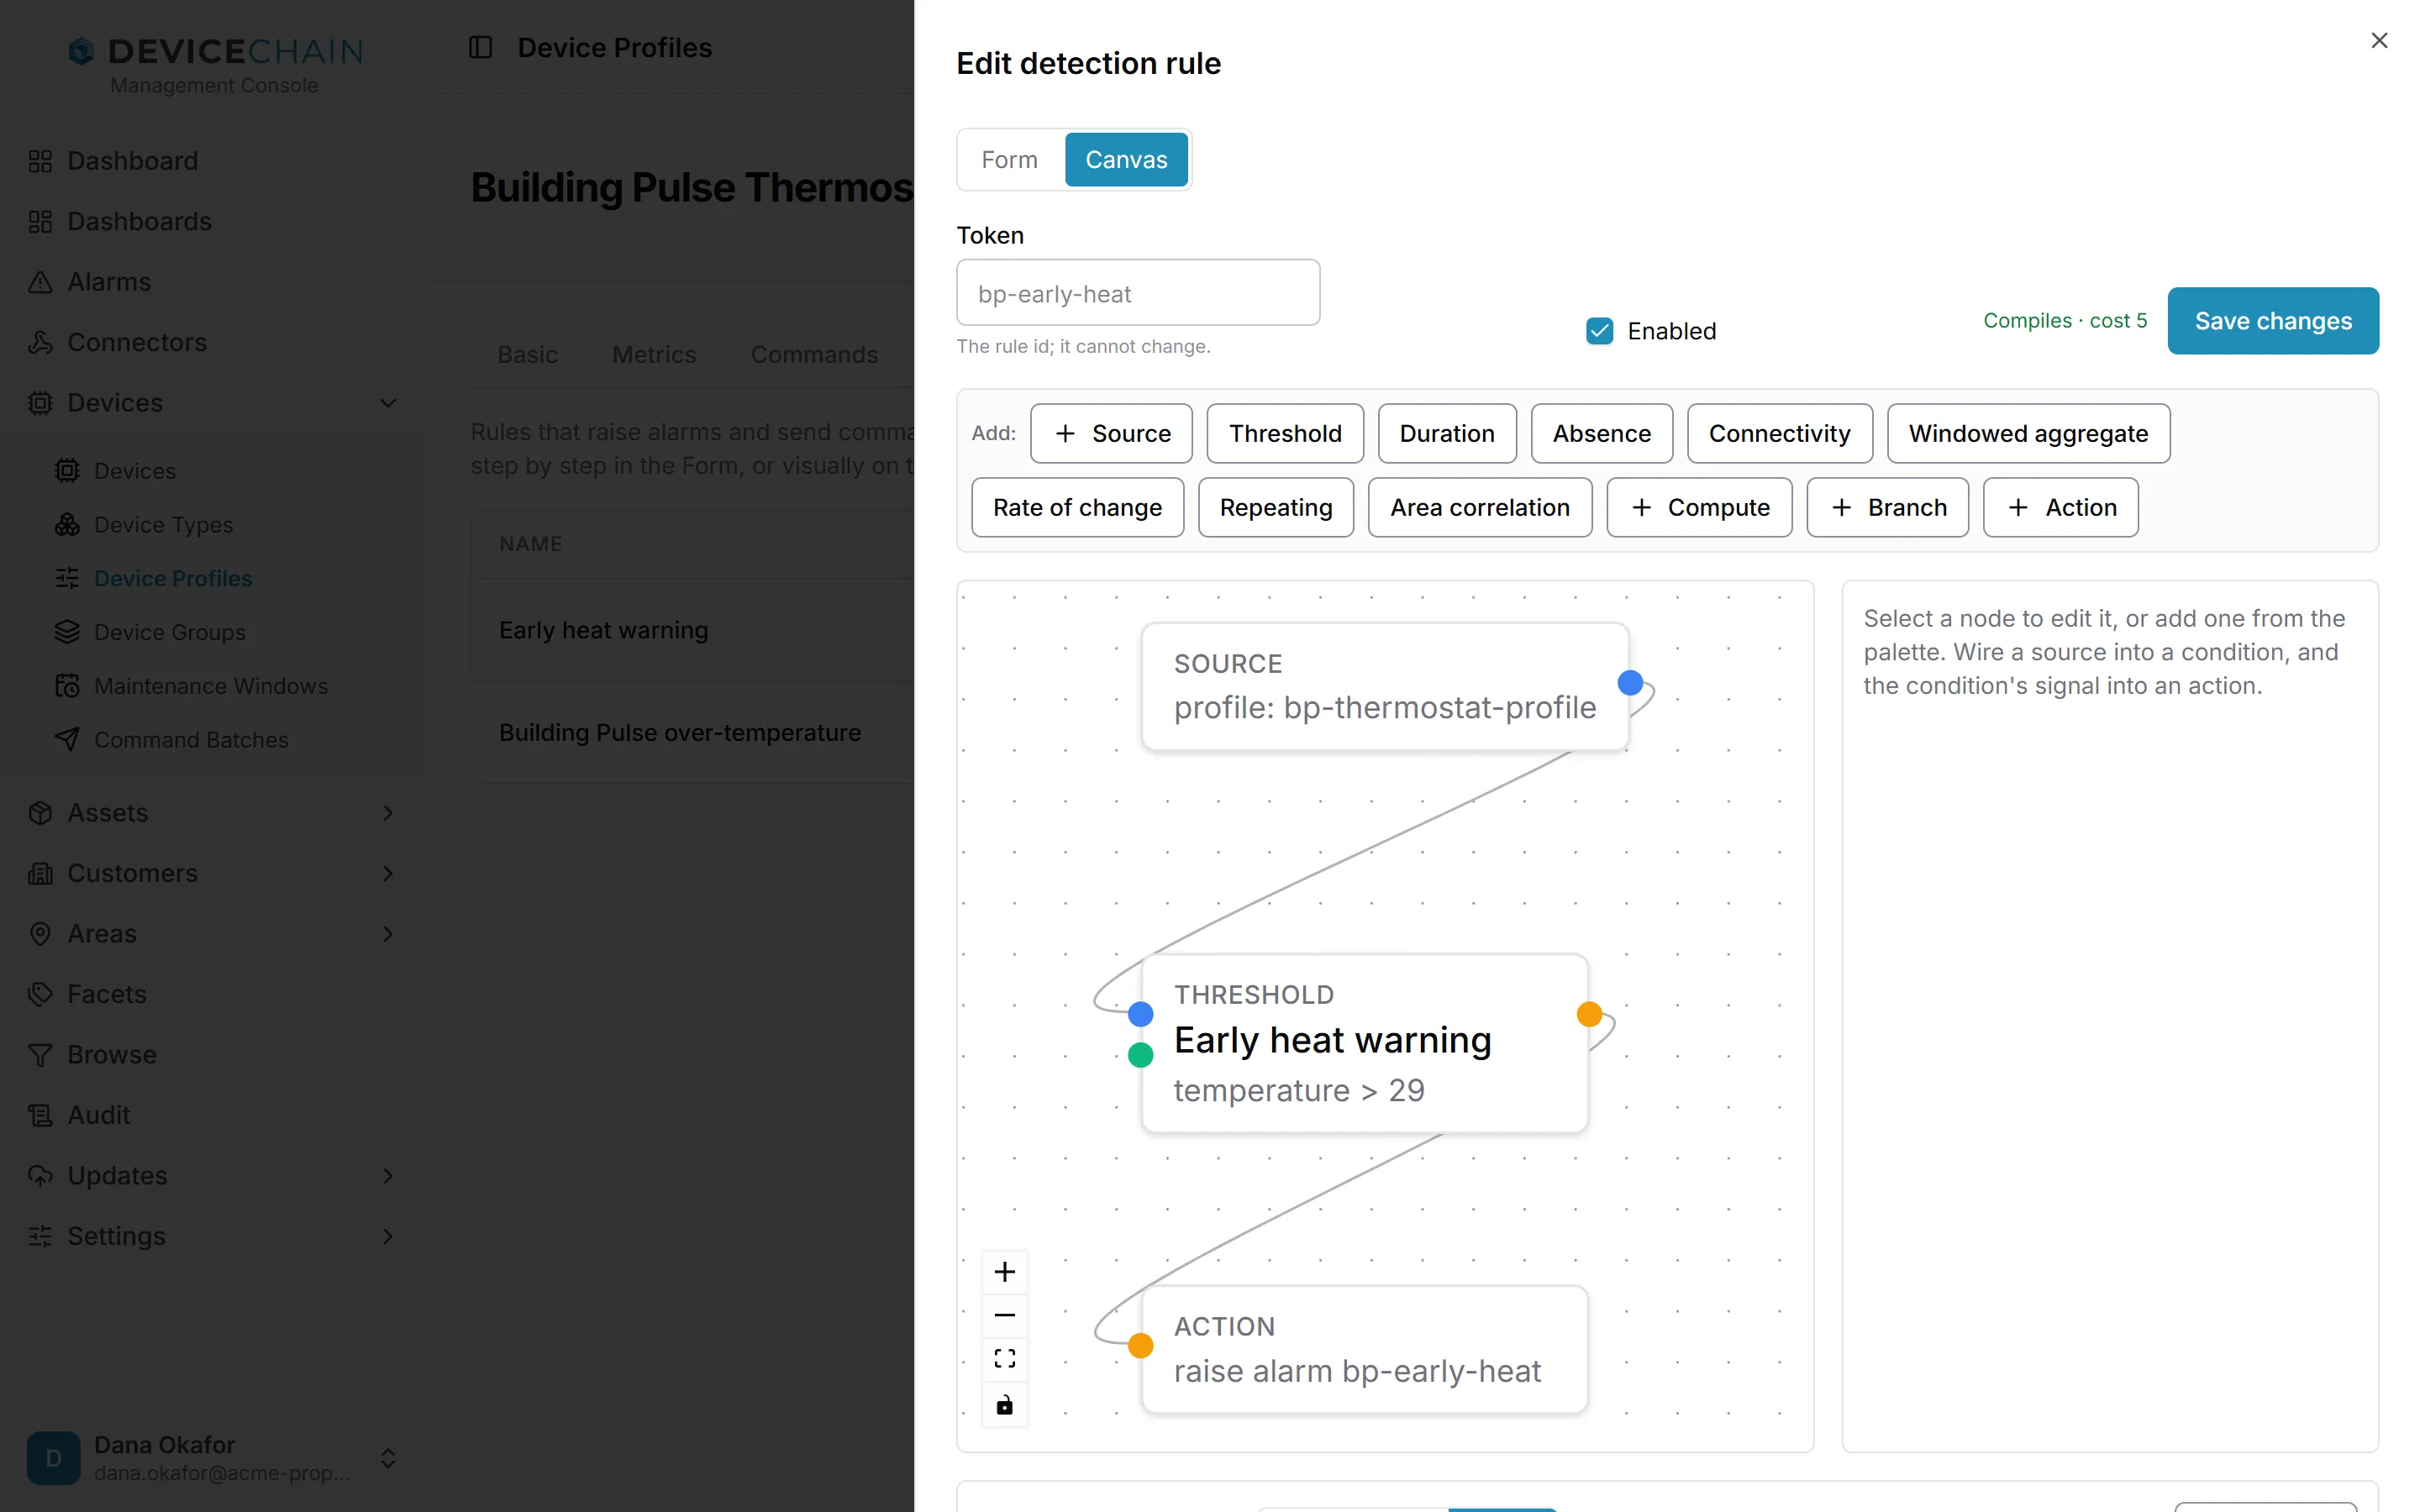
How to work on the canvas:
- Add nodes from the palette on the Add: row. There is a node for every rule type, plus Compute (name a derived value), Branch (send a firing to different actions depending on a condition) and Action.
- Wire a source into a condition, and the condition into an action.
- Select a node to edit it in the panel on the right.
- Watch the badge beside the save button. Compiles means the rule is valid; the cost figure is the compiler's estimate of how expensive the rule is to evaluate.
The form and the canvas edit the same rule. A guard authored on the canvas is shown, and kept, when you open the rule in the form. If a stored rule has settings the canvas cannot show, the canvas says so and turns saving off rather than drop them.
Describing a rule in plain language
Describe lets you type what you want, for example Raise a warning when the lobby thermostat stays above 28 degrees for ten minutes, and choose Draft rule. An AI model drafts the rule, the compiler checks it, and the draft opens in the form for you to review and save. Nothing is saved until you do.
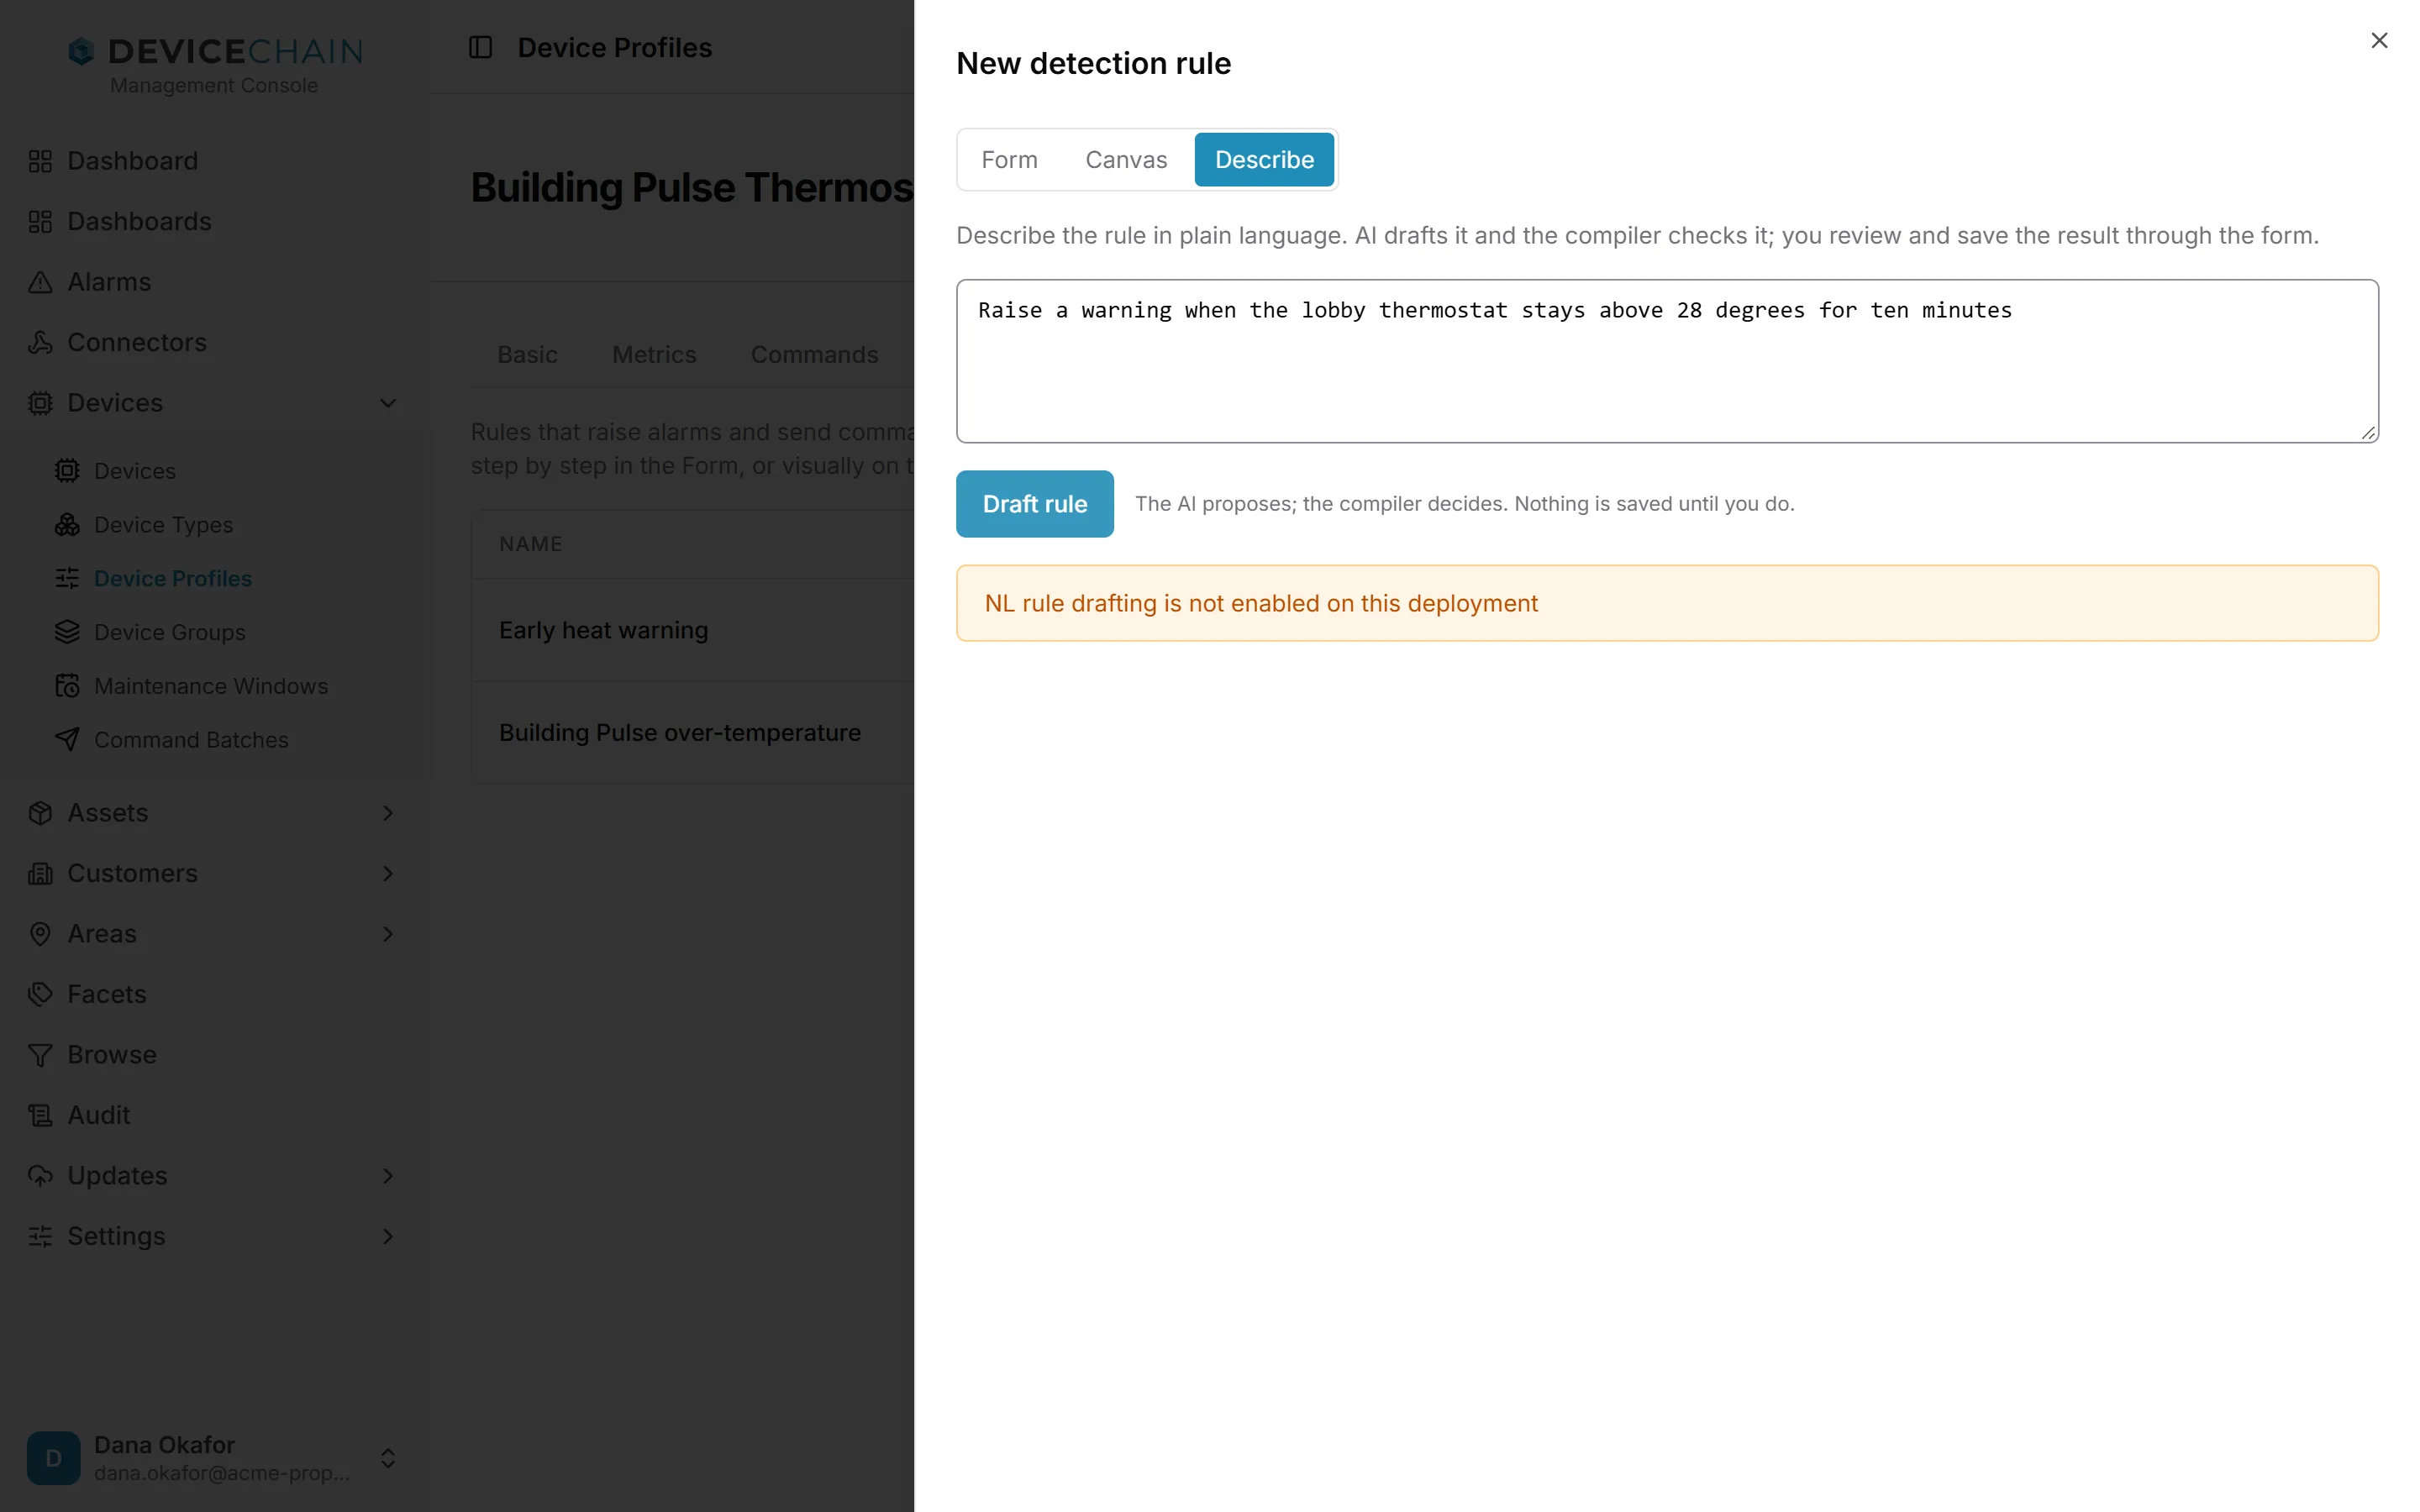
Describe needs the instance's AI service, and the tenant must be allowed to use it. When it is not available, as on the instance in the screenshot, the drawer shows a notice and you can still use the form or the canvas. If a draft does not compile after several attempts, the console says so and shows what the AI tried, so you can refine the description. See AI-assisted authoring for how drafting works and who enables it.
Previewing against history
Before you publish a rule, you can see what it would have done. Preview against history replays the profile's recorded telemetry through the rule and lists the alarms it would have raised and resolved. Nothing is published, and no alarm is created.
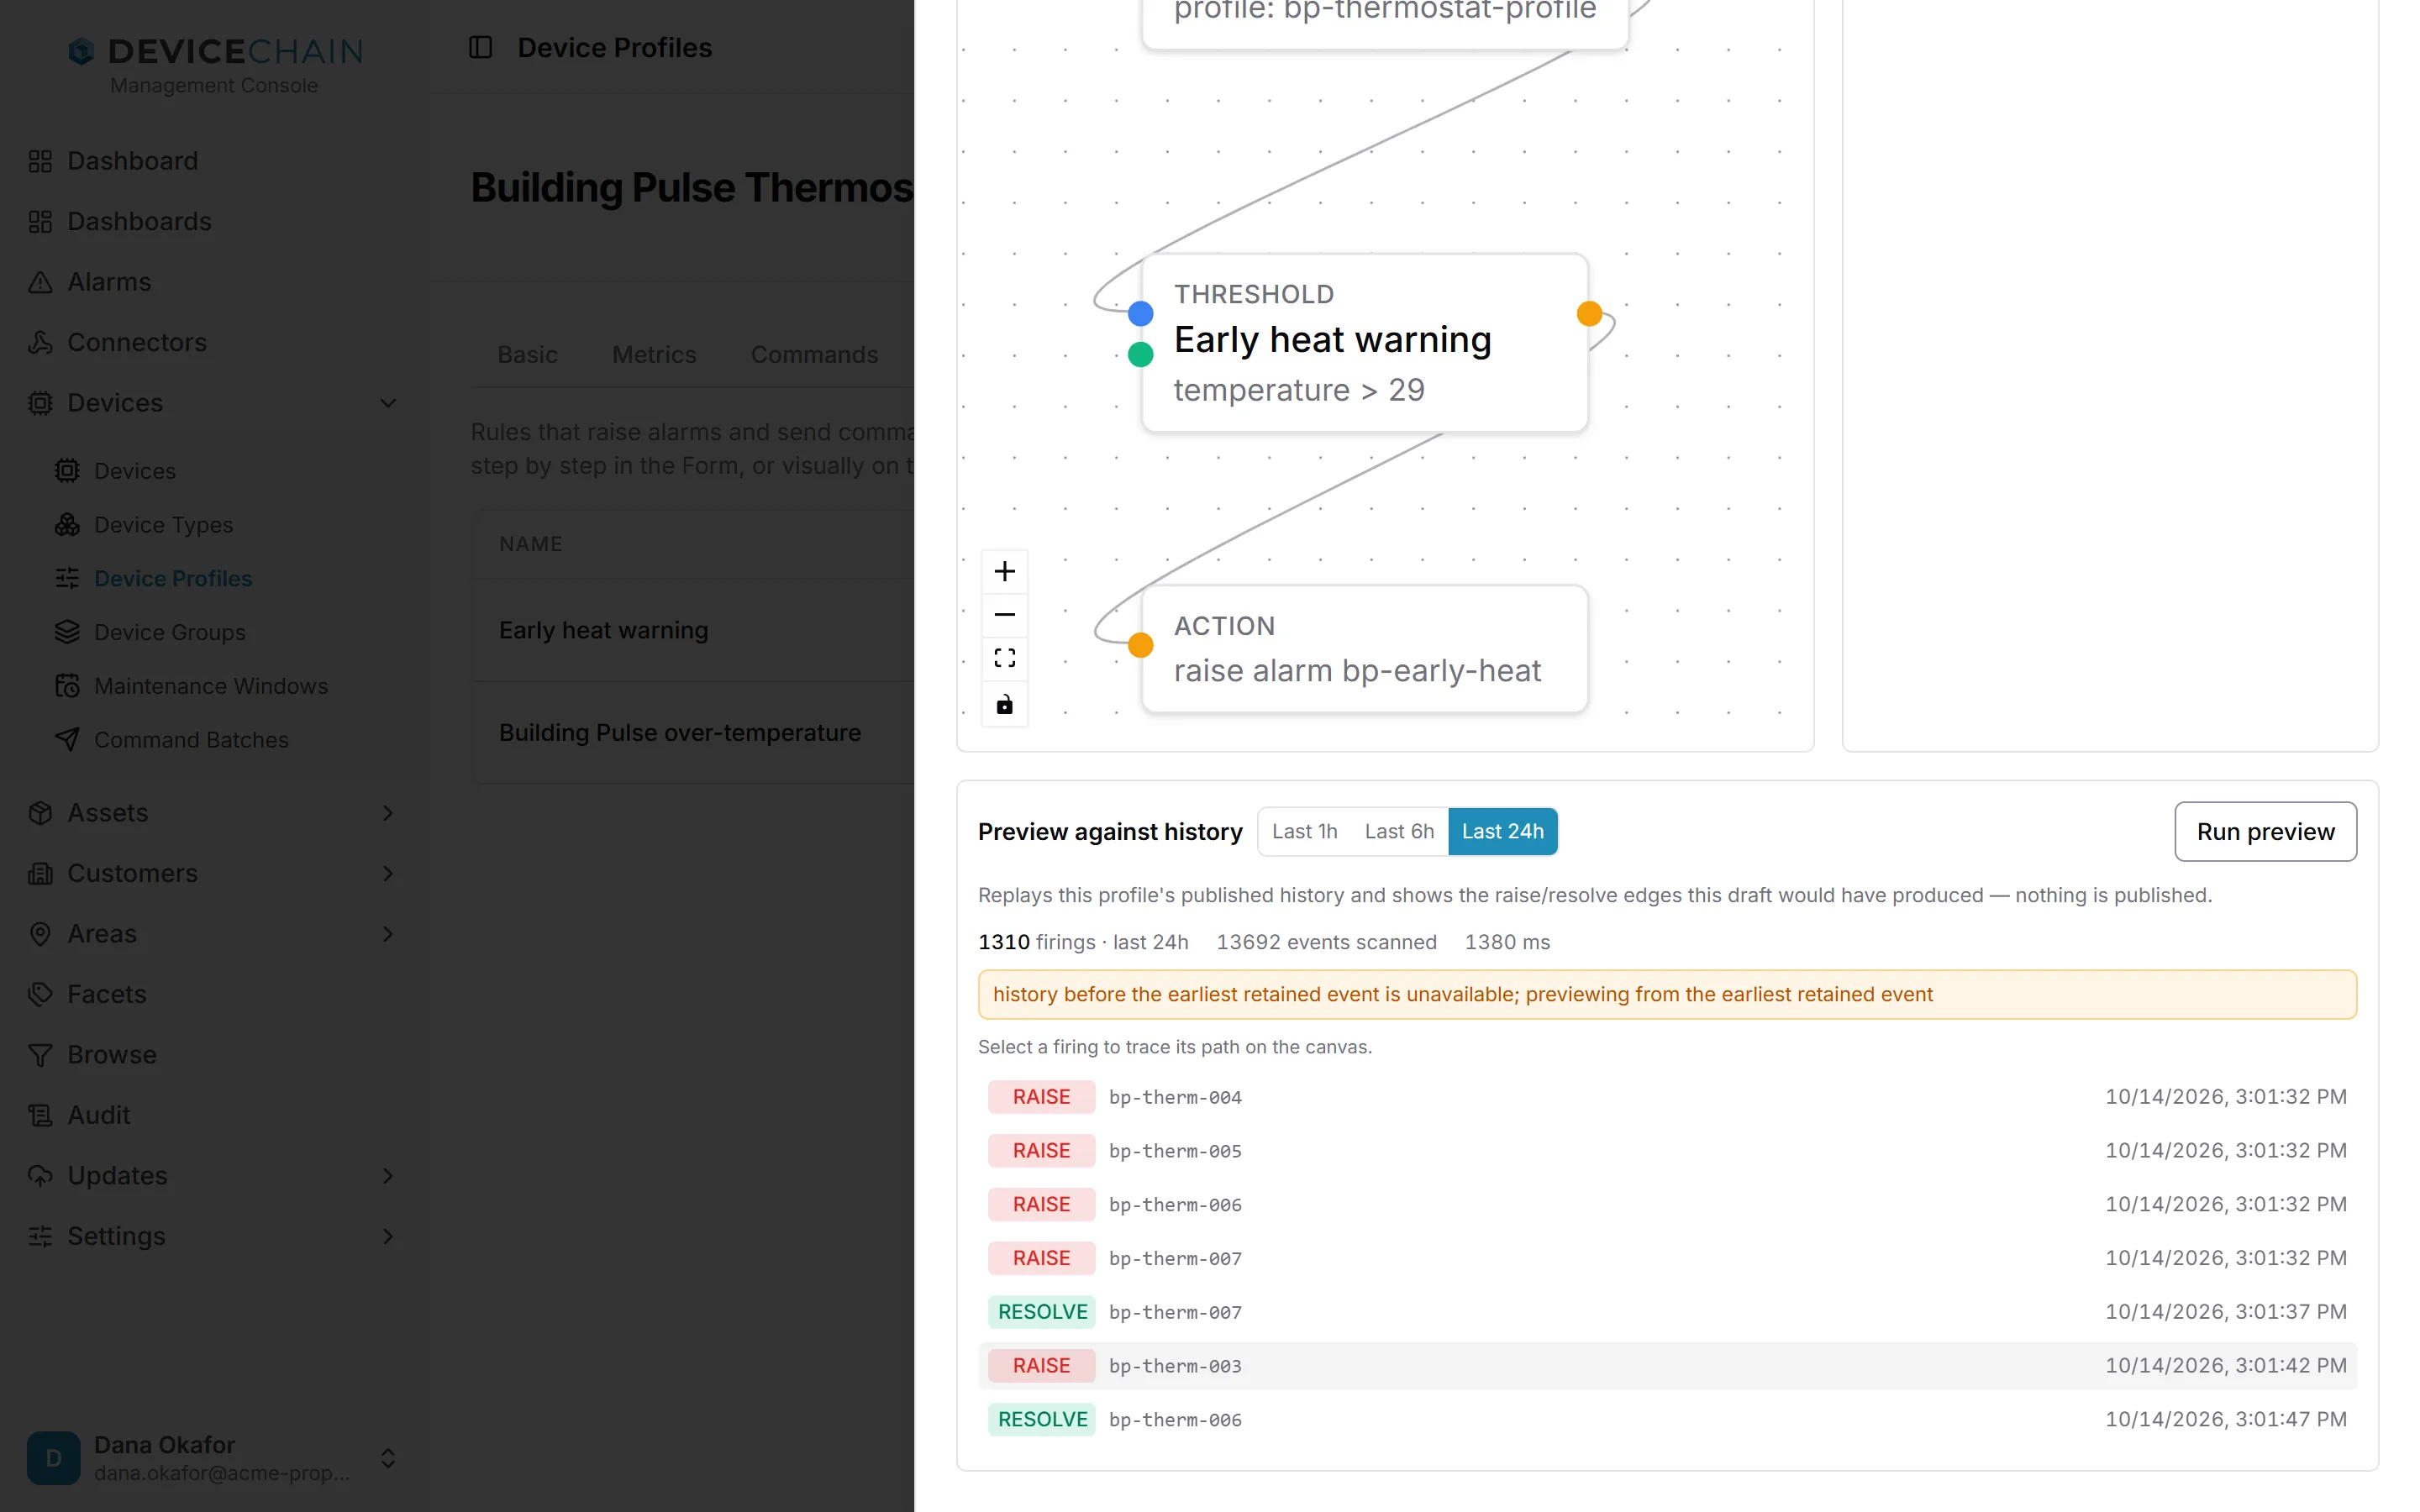
- Choose a window: Last 1h, Last 6h or Last 24h.
- Choose Run preview.
- Read the result: how many firings, how many events were scanned, and a list of RAISE and RESOLVE rows, each naming the device and the time.
On the canvas, selecting a firing traces its path through the nodes, so you can see which condition matched and which action ran. The form has the same panel without the trace. The preview runs only once the rule compiles.
If the profile does not hold history as far back as the window, the panel says so and previews from the earliest event it has. The preview is a guide, not a guarantee: it replays from a cold start, so a rule that waits for a long silence previews less accurately.
Rule health and the live feed
The Rule Health tab answers "is my rule working?" for the profile's active published version.
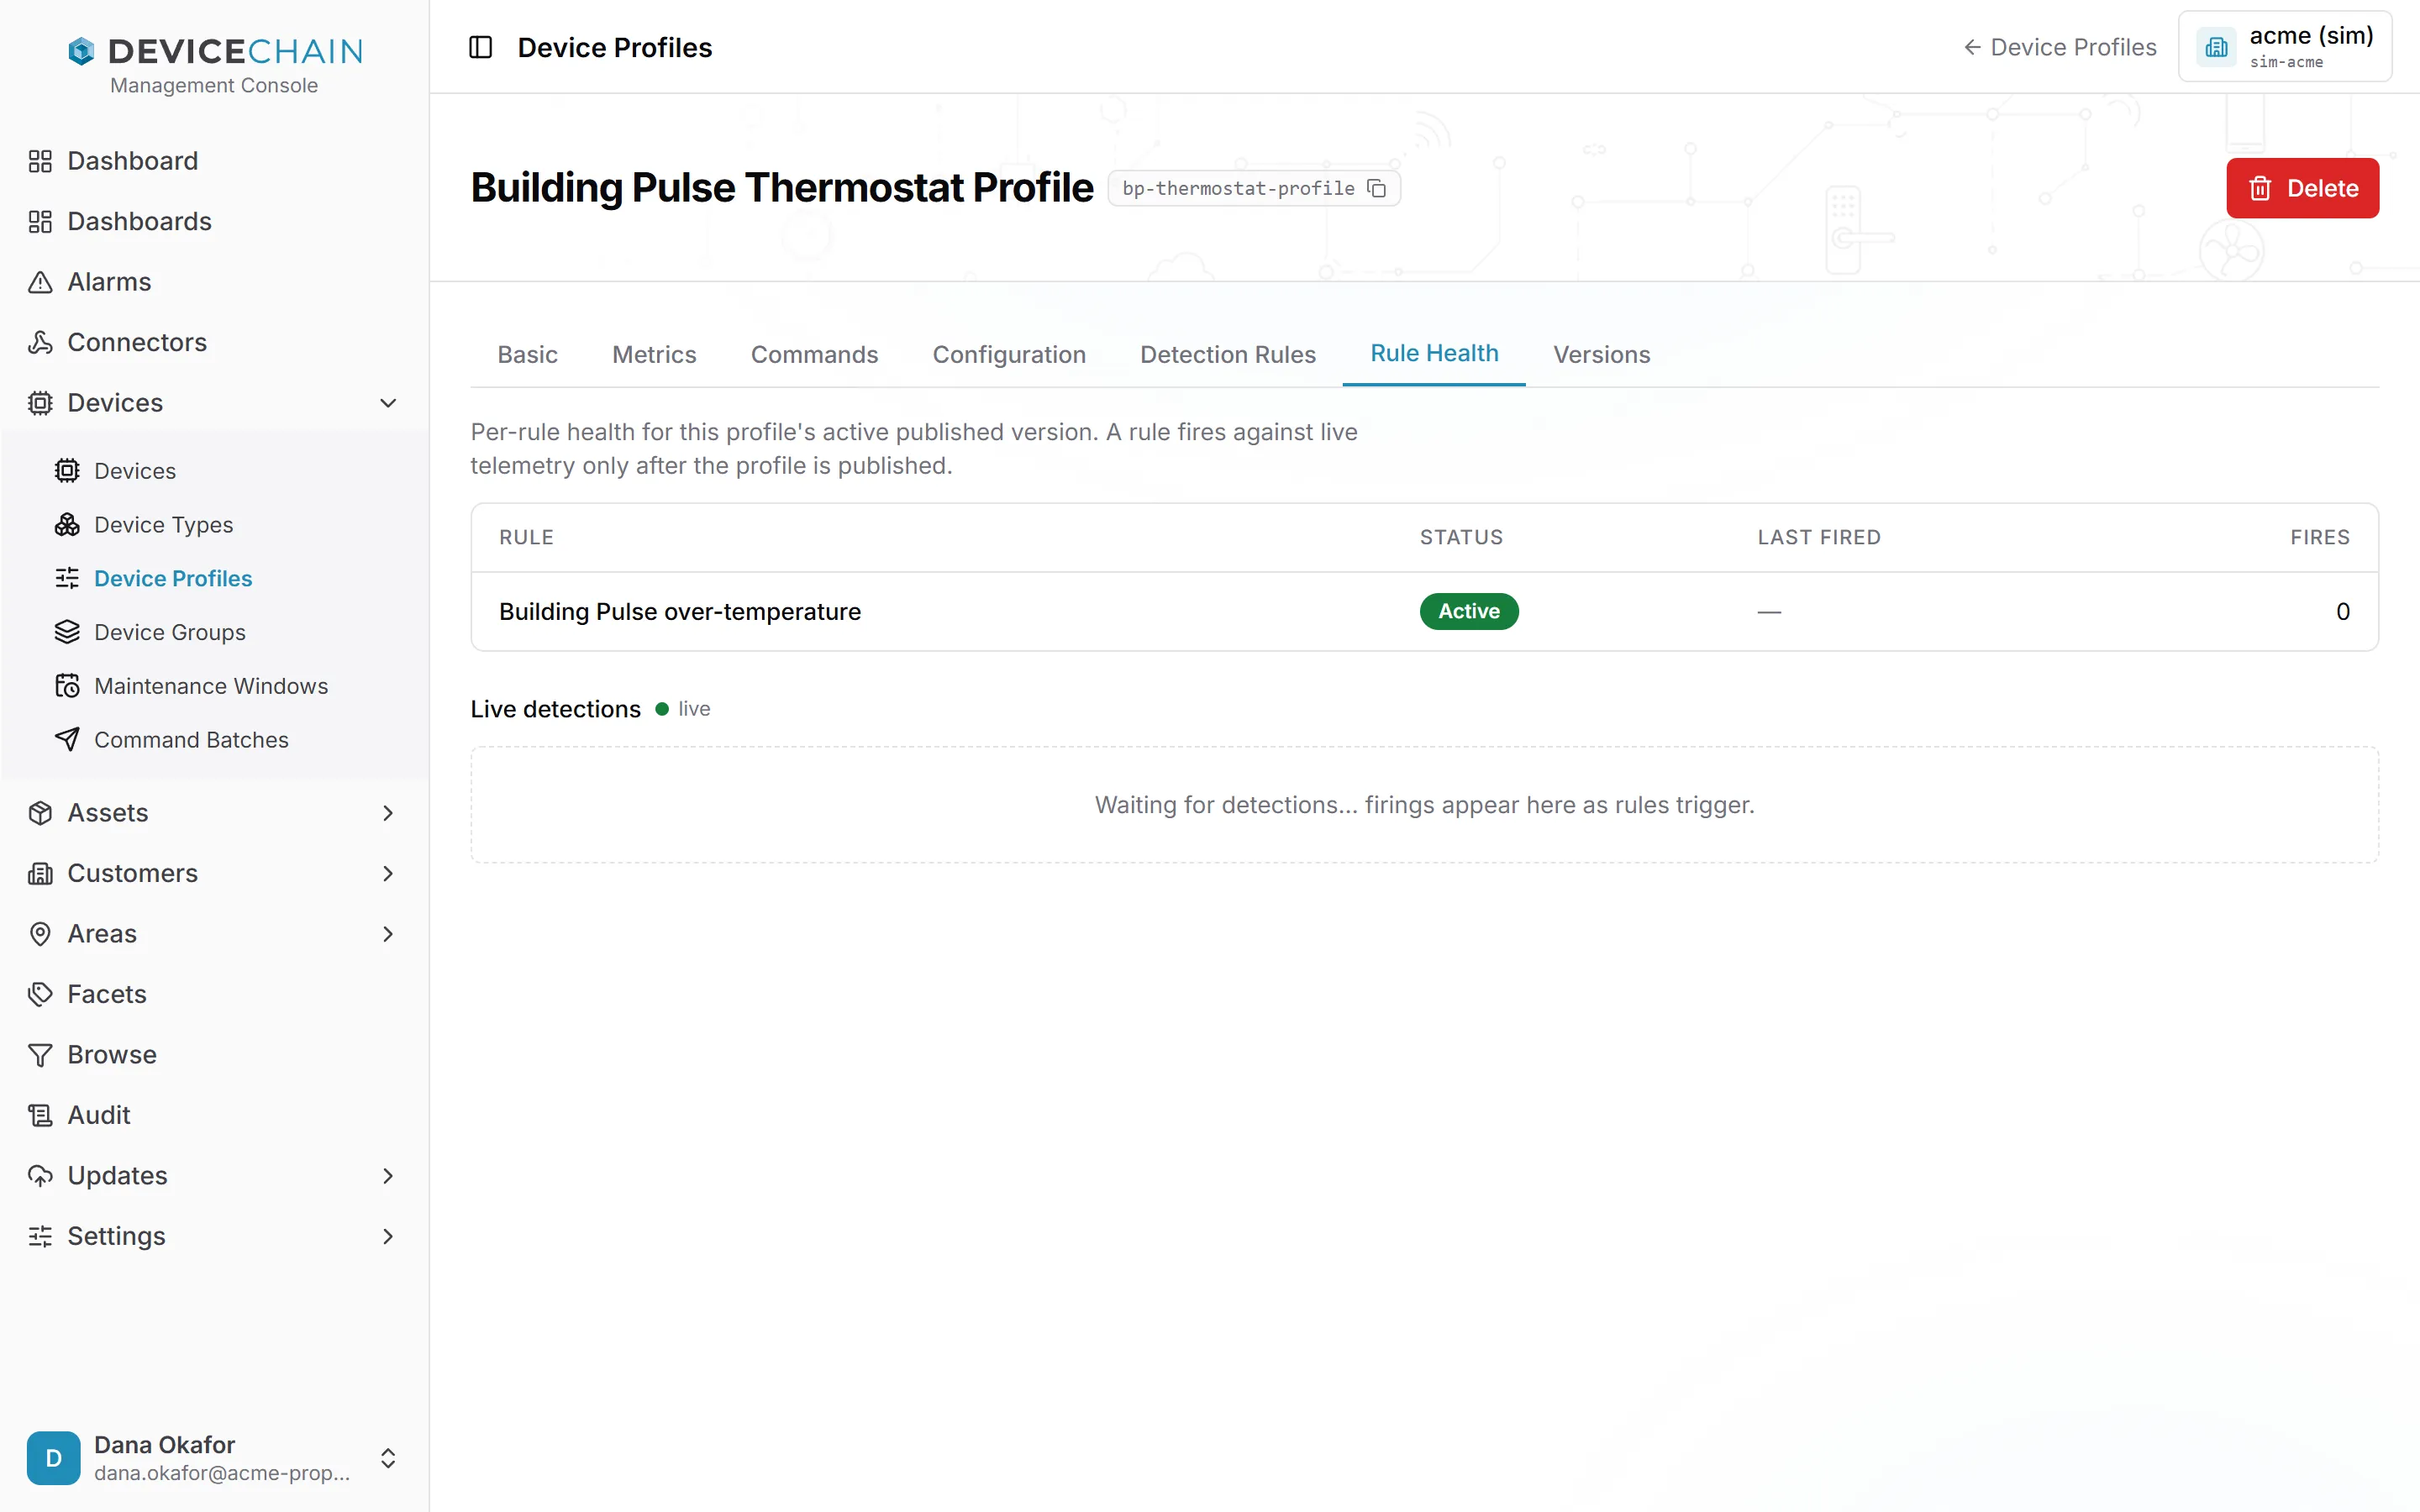
- The table lists each published rule with its Status, when it Last fired and how many times it Fires in total. Active means the rule is running. Compile error means the published rule could not be compiled, and the message explains why.
- Live detections shows firings as they happen, each marked raised or resolved. The dot beside the heading shows whether the feed is connected.
Only published rules appear here. In the screenshot, Early heat warning is missing from the table because it exists only in the profile's draft.
Related
- Event processing and alarms: rule types, actions and the alarm lifecycle
- AI-assisted authoring
- Configuring notification channels
- Outbound connectors, for the webhook and publish actions